Archive for the 'Linux CFS Performance' Category

Standard File System Tools? We Don’t Need No Standard File System Tools!

Yesterday I posted a blog entry about copying files on Solaris. I received some side channel email on the post such as one with the following tidbit from a very good, long time friend of mine. He wrote:

So optimizing cp() is now your hobby? What’s next….. “ed”… no wait “df”.. boy it sure would be great if I could get a 20% improvement in “ls”… I am sure these commands are limiting the number of orders/hr my business can process :)))

Didn’t that blog entry show a traditional cp(1) implementation utilizing 26% less kernel mode processor cycles? Oh well.

It’s About the Whole System
While those were words spoken in jest, it warrants a blog entry and I’ll tell you why. It is true this is an Oracle related blog and such filesystem tools as cp(1) are not in the Oracle code path. I blog about these things for two reasons: 1) a lot of my readers enjoy learning more about the platform in general and 2) many—perhaps most—Oracle systems have normal file system tools such as cp(1), compress(1) and others running while Oracle is running. For that matter, the Oracle server can call out to the same libraries these tools use for such functionality as BFILE and UTL_FILE. For that reason, I feel these topics are related to Oracle platforms. After all, a garbage-can implementation of the standard filesystem tools—and/or the kernel code paths that service them—is going to take cycles away from Oracle. Now please don’t quote me as saying the mmap()-enabled Solaris cp(1) is a “garbage-can” implementation. I’m just making the point that if such tools are implemented poorly Oracle can be affected even though they are not in the scope of a transaction. It’s about the whole system.

Legacy Code. What Comes Around…Stays Around.
Let’s not think for even a moment that the internals of such tools as ls(1) and df(1) are beyond scrutiny. Both ls(1) and df(1) use the stat(2) system call. We Oracle-minded folks often forget that there is much more unstructured data than structured so it is a good thing there are still some folks like PolyServe (HP) minding the store for the performance of such mundane topics as stat(2). Why? Well, perfect examples are the online photo operations such as Snapfish. Try having thousands of threads accessing tens of millions of files (photos) for fun. See, Snapfish uses the HP Enterprise File Services Clustered Gateway NAS powered by PolyServe. You can bet we pay attention to “mundane” topics like what ls(1) behaves like in a directory with 1, 2 or 100 million small files. The stat(2) system call is extremely important in such situations.

He’s Off His Rocker—This is an Oracle Blog.
What could this possibly have to do with Oracle? Well, if you run Oracle on a platform that only specializes in the code underpinnings of the most common server I/O (e.g., db file sequential read, db file scattered read, direct path read/write, LGWR and DBWR writes), you might not end up very happy if you have to do things that hammer the filesystem with Oracle features like UTL_FILE, BFILE, external tables, imp/exp and so forth, cp(1), tar(1), compress(1) and so on. It’s all about taking a holistic view instead of “camps” that focus on segments of the I/O stack.

As the cliché goes, standard file operations and highly specialized Oracle code paths are often joined at the hip.

Standard File Utilities with Direct I/O

In my last blog entry about Direct I/O, I covered the topic of what Direct I/O can mean beyond normal Oracle database files. A reader followed up with a comment based on his experience with Direct I/O via Solaris –forcedirectio mount option:

I’ve noticed that on Solaris filesystems with forcedirectio , a “compress” becomes quite significantly slower. I had a database where I was doing disk-based backups and if I did “cp” and “compress” scripting to a forcedirectio filesystem the database backup would be about twice as long as one on a normally mounted filesystem.

I’m surprised it was only twice as slow. He was not alone in pointing this out. A fellow OakTable Network member who has customers using PolyServe had this to say in a side-channel email discussion:

Whilst I agree with you completely, I can’t help but notice that you ‘forgot’ to mention that all the tools in fileutils use 512-byte I/Os and that the response time to write a file to a dboptimised filesystem is very bad indeed…

I do recall at one point cp(1) used 512byte I/Os by default but that was some time ago and it has changed. I’m not going to name the individual that made this comment because if he wanted to let folks know who he is, he would have made the comment on the blog.  However, I have to respectfully disagree with this comment. It is too broad and a little out of date. Oh, and fileutils have been rolled up into coreutils actually. What tools are those? Wikipedia has a good list.

When it comes to the tools that are used to manipulate unstructured data, I think the ones that matter the most are cp, dd, cat, sort, sum, md5sum, split, uniq and tee. Then, from other packages, there are tar and gzip. There are others, but these seem to be the heavy hitters.

Small Bites
As I pointed out in my last blog entry about DIO, the man page for open(2) on Enterprise Linux distributions quotes Linus Torvalds as saying:

The thing that has always disturbed me about O_DIRECT is that the whole interface is just stupid, and was probably designed by a deranged monkey on some serious mind-controlling substances

I beg to differ. I think he should have given that title to anyone that thinks a program like cp(1) needs to operate with little itsy-bitsy-teenie-weenie I/Os. The following is the current state of affairs (although not exhaustive) as per measurements I just took with strace on RHEL4:

  • tar: 10KB default, override with –blocking-factor
  • gzip: 32KB in/16KB out
  • cat, md5sum, split, uniq, cp: 4KB

So as you can see these tools vary, but the majority do operate with insidiously ridiculous small I/O sizes. And 10KB as the default for tar? Huh? What a weird value to pick out of the air. At least you can override that by supplying an I/O size using the –blocking-factor option. But still, 10KB? Almost seems like the work of “deranged monkeys.” But is all lost? No.

Open Source
See, I just don’t get it. Supposedly Open Source is so cool because you can read and modify source code to make your life easier and yet people are reluctant to actually do that.  As far as that list of coreutils goes, only cp(1) causes a headache on a direct I/O mounted filesystem because you can’t pipeline it. Can you imagine the intrusive changes one would have to make to cp(1) to stop doing these ridiculous 4KB operations? I can, and have. The following is what I do to the coreutils cp(1):

copy.c:copy_reg()
/* buf_size = ST_BLKSIZE (sb);*/
buf_size = 8388608 ;

Eek! Oh the horror. Imagine the testing! Heaven’s sake! But, Kevin, how can you copy a small file with such large I/O requests? The following is a screen shot of two copy operations on a direct I/O mounted filesystem. I copy once with my cp command that will use a 8MB buffer and then again with the shipping cp(1) which uses a 4KB buffer.

fig4.jpg

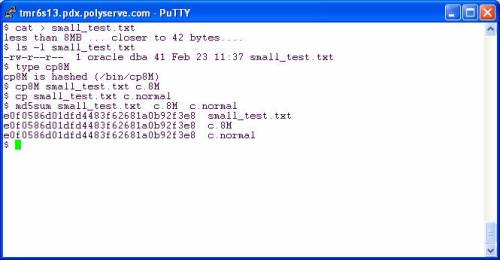
Folks, in both cases the file is smaller than the buffer size. The custom cp8M will use an 8MB buffer but can safely (and quickly) copy a 41 byte file the same way the shipping cp(1) does with a 4KB buffer. The file is smaller than the buffer in both cases—no big deal.

So then you have to go through and make custom file tools right? No, you don’t. Let’s look at some other tools.

Living Happily With Direct I/O
…and reaping the benefits of not completely smashing your physical memory with junk that should not be cached. In the following screen shot I copy a redo log to get a working copy. My current working directory is a direct I/O mounted PSFS and I’m on RHEL4 x86_64. After copying I used gzip straight out of the box as they say. I then followed that with a pipeline command of dd(1) reading the infile with 8MB reads and writing to the pipe (stdout) with 8MB writes. The gzip command is reading the pipe with 32KB reads and in both cases is writing the compressed output with 16KB writes.

fig5.jpg

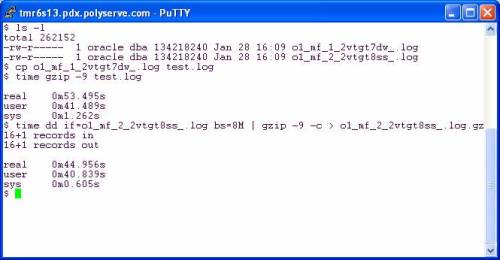
It seems gzip was written by monkeys who were apparently not deranged. The effect of using 32KB input and 16KB output is apparent. There was only a 16% speedup when I slammed 8MB chucks into gzip on the pipeline example. Perhaps the sane monkeys that implemented gzip could talk to the deranged monkeys that implemented all those tools that do 4KB operations.

What if I pipeline so that gzip is reading and writing on pipes but dd is adapted on both sides to do large reads and writes? The following screen shot shows that using dd as the reader and writer does pick up another 5%:

fig6.jpg

So, all told, there is 20% speedup to be had going from canned gzip to using dd (with 8MB I/O) on the left and right hand of a pipeline command. To make that simpler one could easily write the following scripts:

#!/bin/bash

dd if=$1 bs=8M

and

#!/bin/bash

dd of=$1 bs=8M

Make these scripts executable and use as follows:

$ large_read.sh file1.dbf | gzip –c -9 | large_write.sh file1.dbf.gz

But why go to that trouble? This is open source and we are all so very excited that we can tweak the code. A simple change to any of these tools that operate with 4KB buffers is very easy as I pointed out above. To demonstrate the benefit of that little tiny tweak I did to coreutils cp(1), I offer the following screen shot. Using cp8M offers a 95% speedup over cp(1) by moving 42MB/sec on the direct I/O mounted filesystem:

fig7.jpg

More About cp8M
Honestly, I think it is a bit absurd that any modern platform would ship a tool like cp(1) that does really small I/Os. If any of you can test cp(1) on, say, AIX, HP-UX or Solaris you might find that it is smart enough to do large I/O requests if is sees the file is large. Then again, since OS page cache also comes with built-in read-ahead, the I/O request size doesn’t really matter since the OS is going to fire off a read-ahead anyway.

Anyway, for what it is worth, here is the README that we give to our customers when we give them cp8M:

$ more README

INTRODUCTION
Files stored on DBOPTIMIZED mounted filesystems do not get accessed with buffered I/O. Therefore, Linux tools that perform small I/O requests will suffer a performance degradation compared to buffered filesystems such as normal mounted PolyServe CFS , Ext3, etc. Operations such as copying a file with cp(1) will be very slow since cp(1) will read and write small amounts of data for every operation.

To alleviate this problem, PolyServe is providing this slightly modified version of the Open Source cp(1) program called cp8M. The seed source for this tool is from the coreutils-5.2.1 package. The modification to the source is limited to changing the I/O size that cp(1) issues from ST_BLOCKSIZE to 8 MB. The following code snippet is from the copy.c source file and depicts the entirety of source changes to cp(1):

copy.c:copy_reg()

/* buf_size = ST_BLKSIZE (sb);*/

buf_size = 8388608 ;

This program is statically linked and has been tested on the following filesystems on RHEL 3.0, SuSE SLES8 and SuSE SLES9:

* Ext3

* Regular mounted PolyServe CFS

* DBOPTIMIZED mounted PSFS

Both large and small files have been tested. The performance improvement to be expected from the tool is best characterized by the following terminal session output where a 1 GB file is copied using /bin/cp and then with cp8M. The source and destination locations were both DBOPTIMIZED.

# ls -l fin01.dbf

-rw-r–r– 1 root root 1073741824 Jul 14 12:37 fin01.dbf

# time /bin/cp fin01.dbf fin01.dbf.bu
real 8m41.054s

user 0m0.304s

sys 0m52.465s

# time /bin/cp8M fin01.dbf fin01.dbf.bu2

real 0m23.947s

user 0m0.003s

sys 0m6.883s

Using OProfile to Monitor Kernel Overhead on Linux With Oracle

Yes, this Blog post does have OProfile examples and tips, but first my obligatory rant…

When it comes to Oracle on clustered Linux, FUD abounds.  My favorite FUD is concerning where kernel mode processor cycles are being spent. The reason it is my favorite is because there is no shortage of people that likely couldn’t distinguish between a kernel mode cycle and a kernel of corn hyping the supposed cost of running Oracle on filesystem files—especially cluster filesystems. Enter OProfile.

OProfile Monitoring of Oracle Workloads
When Oracle is executing, the majority of processor cycles are spent in user mode. If, for instance, the processor split is 75/25 (user/kernel), OProfile can help you identify how the 25% is being spent. For instance, what percentage is spent in process scheduling, kernel memory management, device driver routines and I/O code paths.

System Support
The OProfile website says:

OProfile works across a range of CPUs, include the Intel range, AMD’s Athlon and AMD64 processors range, the Alpha, ARM, and more. OProfile will work against almost any 2.2, 2.4 and 2.6 kernels, and works on both UP and SMP systems from desktops to the scariest NUMAQ boxes.

Now, anyone that knows me or has read my blog intro knows that NUMA-Q meant a lot to me—and yes, my Oak Table Network buddies routinely remind me that I still haven’t started attending those NUMA 12-step programs out there. But I digress.

Setting Up OProfile—A Tip
Honestly, you’ll find that setting up OProfile is about as straight forward as explained in the OProfile documentation. I am doing my current testing on Red Hat RHEL 4 x86_64 with the 2.6.9-34 kernel. Here is a little tip: one of the more difficult steps to getting OProfile going is finding the right kernel-debug RPM. It is not on standard distribution medium and hard to find—thus the URL I’ve provided. I should think that most people are using RHEL 4 for Oracle anyway.

OProfile Examples
Perhaps the best way to help get you interested in OProfile is to show some examples. As I said above, a very important bit of information OProfile can give you is what not to worry about when analyzing kernel mode cycles associated with an Oracle workload. To that end, I’ll provide an example I took from one of my HP Proliant DL-585’s with 4 sockets/8 cores attached to a SAN array with 65 disk drives. I’m using an OLTP workload with Oracle10gR2 and the tablespaces are in datafiles stored in the PolyServe Database Utility for Oracle; which is a clustered-Linux server consolidation platform. One of the components of the Utility is the fully symmetric cluster filesystem and that is where the datafiles are stored for this OProfile example. The following shows a portion of a statpack collected from the system while OProfile analysis was conducted.

NOTE: Some browsers require you to right click->view to see reasonable resolution of these screen shots

spack


As the statspack shows, there were nearly 62,000 logical I/Os per second—this was a very busy system. In fact, the processors were saturated which is the level of utilization most interesting when performing OProfile. The following screen shot shows the set of OProfile commands used to begin a sample. I force a clean collection by executing the oprofile command with the –deinit option. That may be overkill, but I don’t like dirty data. Once the collection has started I run vmstat(8) to monitor processor utilization. The screen shot shows that the test system was not only 100% CPU bound, but there were over 50,000 context switches per second. This, of course, is attributed to a combination of factors—most notably the synchronous nature of Oracle OLTP reads and the expected amount of process sleep/wake overhead associated with DML locks, background posting and so on. There is a clue in that bit of information—the scheduler must be executing 50,000+ times per second. I wonder how expensive that is? We’ll see soon, but first the screen shot showing the preparatory commands:

opstart

So the next question to ask is how long of a sample to collect. Well, if the workload has a “steady state” to achieve, it is generally sufficient to let it get to that state and monitor about 5 or 10 minutes. It does depend on the ebb and flow of the workload. You don’t really have to invoke OProfile before the workload commences. If you know your workload well enough, watch for the peak and invoke OProfile right before it gets there.

The following screen shot shows the oprofile command used to dump data collected during the sample followed by a simple execution of the opreport command.


opdump


OK, here is where it gets good. In the vmstat(8) output above we see that system mode cycles were about 20% of the total. This simple report shows us a quick sanity check. The aggregate of the core kernel routines (vmlinux) account for 65% of that 20%–13% of all processor cycles. Jumping over the cost of running OProfile (23%) to the Qlogics Host Bus Adaptor driver we see that even though there are 13,142 IOPS, the device driver is handling that with only about 6% of system mode cycles—about 1.2% of all processor cycles.

The Dire Cost of Deploying Oracle on Cluster Filesystems
It is true that Cluster Filesystems inject code in the I/O code path. To listen to the FUD-patrol, you’d envision a significant processor overhead. I would if I heard the FUD and wasn’t actually measuring anything. As an example, the previous screen shot shows that by adding the PolyServe device driver and PolyServe Cluster Filesystem modules (psd, psfs) together there is 3.1% of all kernel mode cycles (.6% of all cycles) expended in PolyServe code—even at 13,142 physical disk transfers per second. Someone please remind me the importance of using raw disk again? I’ve been doing performance work on direct I/O filesystems that support asynchronous I/O since 6.0.27 and I still don’t get it. Anyway, there is more that OProfile can do.

The following screen shot shows an example of getting symbol-level costing. Note, I purposefully omitted the symbol information for the Qlogic HBA driver and OProfile itself to cut down on noise. So, here is a trivial pursuit question: what percentage of all processor cycles does RHEL 4 on a DL-585 expend in processor scheduling code when the system is sustaining some 50,000 context switches per second? The routine to look for is schedule() and the following example of OProfile shows the answer to the trivial pursuit question is 8.7% of all kernel mode cycles (1.7% of all cycles).

sym1

The following example shows me where PolyServe modules rank in the hierarchy of non-core kernel (vmlinux) modules. Looks like only about 1/3rd the cost of the HBA driver and SCSI support module combined.

sym2

If I was concerned about the cost of PolyServe in the stack, I would use the information in the following screen shot to help determine what the problem is. This is an example of per-symbol accounting. To focus on the PolyServe Cluster Filesystem, I grep the module name which is psfs. I see that the component routines of the filesystem such as the lock caching layer (lcl), cluster wide inode locking (cwil) and journalling are evenly distributed in weight—no “sore thumbs” sticking up as they say. Finally, I do the same analysis for our driver, PSD, and there too see no routine accounting for any majority of the total.

sym3

Summary
There are a couple of messages in this blog post. First, since tools such as OProfile exist, there is no reason not to actually measure where the kernel mode cycles go. Moreover, this sort of analysis can help professionals avoid chasing red herrings such as the fairy tales of measurable performance impact when using Oracle on quality direct I/O cluster filesystems. As I like to say, “Measure before you mangle.” To that end, if you do find yourself in a situation where you are losing a significant amount of your processor cycles in kernel mode, OProfile is the tool for you.


DISCLAIMER

I work for Amazon Web Services. The opinions I share in this blog are my own. I'm *not* communicating as a spokesperson for Amazon. In other words, I work at Amazon, but this is my own opinion.

Enter your email address to follow this blog and receive notifications of new posts by email.

Join 747 other subscribers
Oracle ACE Program Status

Click It

website metrics

Fond Memories

Copyright

All content is © Kevin Closson and "Kevin Closson's Blog: Platforms, Databases, and Storage", 2006-2015. Unauthorized use and/or duplication of this material without express and written permission from this blog’s author and/or owner is strictly prohibited. Excerpts and links may be used, provided that full and clear credit is given to Kevin Closson and Kevin Closson's Blog: Platforms, Databases, and Storage with appropriate and specific direction to the original content.

%d bloggers like this: