I recently read a blog post by Kyle Hailey regarding some lack of randomness he detected in the Orion I/O generator tool. Feel free to read Kyle’s post but in short he used dtrace to detect Orion was obliterating a very dense subset of the 96GB file Orion was accessing.
I’ve used Orion for many years and, in fact, wrote my first Orion related blog entry about 8 years ago. I find Orion to be useful for some things and of course DBAs must use Orion’s cousin CALIBRATE_IO as a part of their job. However, neither of these tools perform database I/O. If you want to see how database I/O behaves on a platform it’s best to use a database. So, SLOB it is. But wait! Is SLOB is just another storage cache-poking randomness-challenged distraction from your day job? No, it isn’t.
But SLOB Is So Very Difficult To Use
It’s quite simple actually. You can see how simple SLOB is to set up and test by visiting my picture tutorial.
How Random Is Random? Random!
SLOB is utterly random. However, there are some tips I’d like to offer in this post to show you how you can choose even higher levels of randomness in your I/O testing.
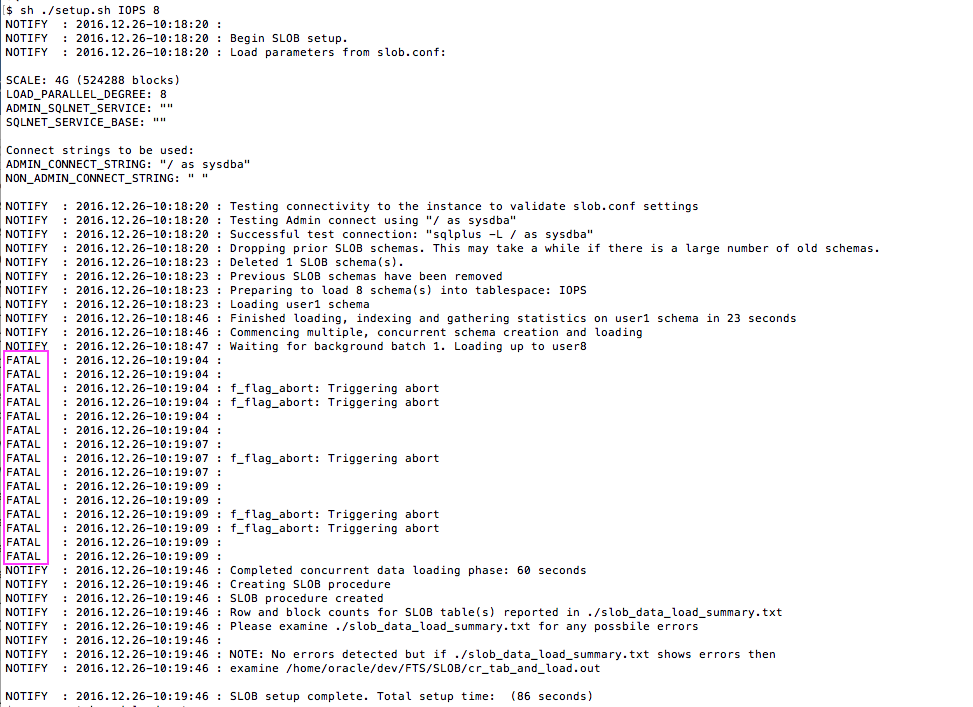
Kyle used dtrace and some shell commands to group block visits into buckets. Since I’m analyzing the randomness of SLOB I’ll use a 10046 trace on the database sessions. First I’ll run a 96 user SLOB test with slob.conf->UPDATE_PCT=0.
After the SLOB test was completed I scrambled around to find the trace files and worked out a simple set of sed(1) expressions to spit out the block numbers being visited by each I/O of type db file sequential read:

I then grouped the blocks being visited into buckets much the same way Kyle did in his post:

I’ll show some analysis of the those buckets later in the post. Yes, SLOB is random as analysis of 96u.blocks.txt will show but it can be even more random if one configures a RECYCLE buffer pool. One of the lesser advertised features of SLOB is the fact that all working tables in the SLOB schemas are created with BUFFER_POOL RECYCLE in the storage clause. The idea behind this is to support the caching of index blocks in the SGA buffer pool. When no RECYCLE pool is allocated there is a battle for footprint in the SGA buffer pool causing even buffers with index blocks to be reused for buffering table/index blocks of the active transactions. Naturally when indexes are not cached there will be slight hot-spots for constant, physical, re-reads of the index blocks. The question becomes what percentage of the I/O do these hot blocks account for?
To determine how hot index blocks are I allocated a recycle buffer pool and ran another 2 minute SLOB test. As per the following screen shot I again grouped block visits into buckets:

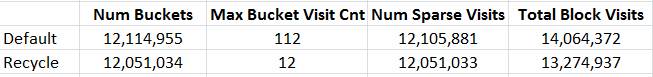
After having both SLOB results (with and without RECYCLE buffer pool) I performed a bit of text processing to determine how different the access patterns were in both scenarios. The following shows:
- The vast majority of blocks are visited 10 or less times in both models
- The RECYCLE pool model clearly flattens out the re-visit rates as the hotest block is visited only 12 times compared to the 112 visits for the hottest block in the default case
- If 12 is the golden standard for sparsity (as per the RECYCLE pool test case) then even the default is quite sparse because dense buckets accounted for only 84,583 physical reads compared to the nearly 14 million reads of blocks in the sparse buckets

The following table presents the data including the total I/O operations traced. The number of sparse visits are those blocks that were accessed less than or equal to 10 times during the SLOB test. I should point out that there will naturally be more I/O during a SLOB test when index accesses are forced physical as is the case with the default buffer pools. That is, the RECYCLE buffer pool case will have a slightly higher logical I/O rate (cache hits) due to index buffer accesses.

Summary
If you want to know how database I/O performs on a platform use a database. If using a database to test I/O on a platform then by all means drive it with SLOB ( a database I/O tool).
Regarding randomness, even in the default case SLOB proves itself to be very random. If you want to push for even more randomness then the way forward is to configure db_recycle_cache_size.
Enjoy SLOB! The best place to start with SLOB is the SLOB Resources Page.


Recent Comments