Archive for the 'DBWR Performance' Category

Over-Configuring DBWR Processes – Part III

Sometimes the comment thread on a blog entry are important enough to warrant yet another blog entry. This is one of those times. In my blog entry called Over-Configuring DBWR Processes Part II I offered some test results showing that it really is best to keep a single writer until such time as a single writer becomes CPU-bound. But first a disclaimer.

DISCLAIMER: There are ports of Oracle where specialized multiple DBWR code is implemented for specific hardware architecture (e.g., NUMA). I ought to know, I worked on one of the very first (if not the first) to do so with the ports to Sequent DYNIX/ptx.

There, disclaimer aside, I am talking about the Linux ports of 10g and 11g which have no such hardware specialization.

The first question in that comment thread was:

From what’s written here, it looks like you only tested 1 and 8. Is it possible that the global maximum is actually somewhere between? Maybe 2 processes is slightly faster than 1, for example?

Great question with a simple answer: use 1 writer as long as that single writer has ample bandwidth. That is a truth, but I figured I’d do some runs to milk out a fact or two. I configured 2 DBWR processes and re-ran the workload I describe in Part II of this series. I followed that up with 4 DBWR processes. Hey, it’s all auto-pilot stuff with my setup so doing this was no big deal. Let’s compare the results. Just to summarize, the previous configurations performed as follows:

Configuration

OLTP Throughput (TPM)

Aggregate DBWR CPU Usage

1 DBWR

62.6

291

8 DBWR

57.9

256

And now with the 2 and 4 DBWR cases:

Configuration

OLTP Throughput (TPM)

Aggregate DBWR CPU Usage

1 DBWR

62.6

291

2 DBWR

58.7

273

4 DBWR

58.4

269

8 DBWR

57.9

256

The way this goes is that more DBWR processes impact throughput. On the other hand, more throughput will require more DBWR work so the optimal case of 1 DBWR process will take more CPU, but remember that it is also getting more throughput. I only provide these CPU numbers to show what percentage of a single CPU any given configuration utilizes. I don’t think it is necessary to run the 6 DBWR case. But what about a wildcat configuration such as multiple DBWR processes that have hard processor affinity?

Processor Affinity and Oracle Background Processes
Well, I’d never bind an Oracle background process to a singe processor (core) for obvious reasons, but with the Linux taskset(1) command it is possible to bind a running process to a socket. For example, the following command binds pid 13276 to the seconds socket of a mulit-socket system:

# taskset –pc 2-3 13276

Building on that idea, you can grab DBWR processes (or any process for that matter) once they are running and pin them to a CPU core or a set of CPU cores. The following stupid bash shell function can be used to do this sort of thing. Note, since there are tens of thousands of skilled computer programmers out there these days, all shell scripts are considered stupid of course. The function takes an argument that it then uses in its grep regular expression for globbing ps(1) output. An example would be:

aff ora_dbw
aff()
{
local GLOB="$1"
local CORE=0
local TWIN=0

ps -ef | grep $GLOB | grep -v grep | awk '{ print $2 }'  | while read PID
do
        (( TWIN = $CORE + 1 ))

        set -x
        sudo taskset -pc ${CORE}-${TWIN} $PID
        set -    

        (( CORE = CORE + 2 ))
        [[ $CORE = 8 ]] && CORE=0 && TWIN=0
done
}

I used this script to affinity 2 DBWR processes to a single socket and the numbers didn’t change. Neither did throwing 2 DBWR processes one each to two different sockets. The fact simply remains that DBWR doesn’t benefit from having peers unless it is CPU-bottlenecked.

Over-Configuring DBWR Processes – Part II.

In my recent blog entry about over-configuring DBWR processes, I mentioned the processor cache effect of having too many DBWR processes doing work that a single DBWR process could handle. I’d like to provide more detail on the matter.

Backgrounder
Few people really understand what DBWR does for a living. Yes, everyone knows DBWR is responsible for flushing modified buffers from the SGA, but that is really high level. DBWR:

  • 1. Builds “write batches” by examining the state of buffer headers on the LRU lists. It scans the LRU end considering the age of the buffer. At instance boot time, each DBWR process is assigned a set of LRUs to tend to.
  • 2. Manipulates cache buffers chains elements for such reasons as marking the buffer busy when it is in flight for an I/O and marking it as written after the flush operation.
  • 3. Performs I/O using the OSDs that are available to it. OSDs are routines in the Oracle kernel that are Operating System (port) specific. These are the routines through which Oracle gets support for asynchronous and/or direct I/O via calls to various libraries (e.g., libc, libaio, libodm, etc).
  • 4. Posts waiters, such as foreground processes waiting in a free buffer wait event.

The problem with over-configuring DBWR processes is two-fold:

  • 1. Processor Cache Trashing. DBWR processes have huge working sets since they deal with so many LRU and cache buffers chains structures. Having more of these processes than necessary migrating from CPU to CPU places a huge dent in the L2 caches with both page table and data footprint.
  • 2. Scheduling anomalies. If you have more than 1 DBWR process, you run the increased risk of having DBWR processes that can’t get on CPU. Consider a checkpoint. All LRUs will have modified buffers that need flushed during a checkpoint. Any given LRU can only be cleaned by the boot-time assigned DBWR process. That means that a checkpoint requires action from all DBWR processes. It’s easier for 1 process to get scheduled on a CPU on, say, an 8 CPU system than 8 processes.

Point 2 above is the part that I suspect most folks aren’t aware of. I think folks envision the various multiple DBWR processes will only get busy if their peers aren’t keeping up. That is not the case. LRUs get evenly loaded by foreground processes because when a process needs a buffer (for file I/O, sort buffer, block cloning, etc) they first try the LRU latch for the last LRU they used (improves cache warmth) and if they can’t get that latch with a no-wait get, they jump to a different latch and do another no-wait get. This continues until they either obtain an LRU on a no-wait get or they loop around to the first attempted latch and do a wait-get. I recall in older releases of Oracle the next LRU to try was the very next LRU. That could have changed to something like a random selection but I don’t know ( I haven’t seen the code in years but that’s about to change). No matter, the LRUs are evenly loaded. Since LRUs are evenly loaded, that means that DBWR processes are equally tasked. I’m not very smart, but this I know:

On SMP systems it is not wise to break up a task that a single CPU can do and distribute the work evenly amongst multiple CPUs. You introduce processor scheduling overhead and you hammer the processor caches

How true, and even more so when the processes share resources as DBWR processes do-they “share” cache buffers chains and other goodies. Anyway, it might be smart to do such task decomposition on realtime or other specialized systems, but not Oracle systems. Let’s take a closer look.

Moderate OLTP Load, db_writer_processes=8
I just did an OLTP run on my DL585 8-core system with db_writer_processes set to 8. After the instance is booted, but before the Pro*C OLTP clients are triggered, I did a ps(1) command grepping for all the DBWR processes. As soon as the 900 second run was complete, the driver script does the same ps(1) command. All output goes to nohup.out so I can grep for DBWR processes and see how much CPU time they consumed during the run:

$ grep ora_dbw nohup.out
oracle   14507     1  2 13:46 ?        00:00:01 ora_dbw0_bench1
oracle   14509     1  2 13:46 ?        00:00:01 ora_dbw1_bench1
oracle   14511     1  2 13:46 ?        00:00:02 ora_dbw2_bench1
oracle   14513     1  1 13:46 ?        00:00:01 ora_dbw3_bench1
oracle   14515     1  1 13:46 ?        00:00:01 ora_dbw4_bench1
oracle   14517     1  2 13:46 ?        00:00:01 ora_dbw5_bench1
oracle   14519     1  1 13:46 ?        00:00:01 ora_dbw6_bench1
oracle   14521     1  2 13:46 ?        00:00:01 ora_dbw7_bench1
oracle   14507     1  2 13:46 ?        00:00:23 ora_dbw0_bench1
oracle   14509     1  2 13:46 ?        00:00:23 ora_dbw1_bench1
oracle   14511     1  2 13:46 ?        00:00:23 ora_dbw2_bench1
oracle   14513     1  2 13:46 ?        00:00:23 ora_dbw3_bench1
oracle   14515     1  2 13:46 ?        00:00:23 ora_dbw4_bench1
oracle   14517     1  2 13:46 ?        00:00:23 ora_dbw5_bench1
oracle   14519     1  2 13:46 ?        00:00:23 ora_dbw6_bench1
oracle   14521     1  2 13:46 ?        00:00:23 ora_dbw7_bench1

The ps(1) output shows us that each of the 8 DBWR processes accumulated 23 seconds of CPU. This clearly reflects the fact that all LRUs are loaded evenly and that each DBWR has an equal part in keeping them clear. So what’s the point? Well, 8 DBWR processes accumulating 184 CPU seconds (23*8) during a 7200 (8 * 900) CPU-second OLTP run means this DBWR workload could have been serviced by a single CPU. In fact 184 CPU seconds is only 20% of a single CPU core during a 900 second run, yet by configuring 8 DBWR processes we spread that workload over multiple CPUs. I know, you’re thinking this must be a pretty lightly loaded system, right? No, the processors hover around 50% utilization with peaks of 70%. The datafile I/O rate was some 6,980 IOPS of which 4,548/second were writes:

Load Profile                            Per Second       Per Transaction
~~~~~~~~~~~~                       ---------------       ---------------
                  Redo size:          3,222,269.99              4,570.66
              Logical reads:             66,770.61                 94.71
              Block changes:             18,097.81                 25.67
             Physical reads:              2,342.71                  3.32
            Physical writes:              4,548.36                  6.45
                 User calls:             11,795.67                 16.73
                     Parses:              3,597.63                  5.10
                Hard parses:                  0.27                  0.00
                      Sorts:                  1.00                  0.00
                     Logons:                  0.00                  0.00
                   Executes:             10,121.28                 14.36
               Transactions:                704.99

Moderate OLTP Load, db_writer_processes=1
Let’s take a look at the same workload after a shutdown, database restore and reboot of the instance:

$ grep ora_db noh*
oracle   15652     1  0 14:23 ?        00:00:00 ora_dbw0_bench1
oracle   15652     1 17 14:23 ?        00:02:55 ora_dbw0_bench1

What’s that? A single DBWR was able to service the same workload with only 175 CPU seconds? That’s the same work with 5% fewer processor cycles. But what did it do to throughput? Well, this is the medium model of the benchmark where the highest processor utilization peaks were roughly 70%. Reducing CPU utilization on a system that has ample CPU cycles to spare doesn’t get much. In fact, throughput only improved 2.4% from 46.3 Transactions Per Minute (TPM) to 47.4 TPM. Some would say that is within the margin of statistical error, but I bet those same people don’t have a setup were a database restore followed by an instance reboot will produce benchmark results within .5% like this setup does. Let’s just say it’s calibrated. Have you really read this far to hear about a paltry 2.4% difference in OLTP throughput though? No, that’s not all. The impact of too many DBWR processes is scheduling overhead and poor processor cache efficiency, so we need to look at a run with higher CPU utilization.

Heavy OLTP Load, db_writer_processes=8
The following ps(1) data shows us that with the increased OLTP load the 8 DBWR processes each consumed 32 CPU seconds for an aggregate of 256 CPU seconds. That’s still much less than the amount of cycles a single CPU had to offer-28% of a single CPU in fact. S

$ grep ora_db noh*
oracle   20763     1  0 15:59 ?        00:00:00 ora_dbw0_bench1
oracle   20765     1  0 15:59 ?        00:00:00 ora_dbw1_bench1
oracle   20767     1  0 15:59 ?        00:00:00 ora_dbw2_bench1
oracle   20769     1  0 15:59 ?        00:00:00 ora_dbw3_bench1
oracle   20771     1  0 15:59 ?        00:00:00 ora_dbw4_bench1
oracle   20773     1  0 15:59 ?        00:00:00 ora_dbw5_bench1
oracle   20775     1  0 15:59 ?        00:00:00 ora_dbw6_bench1
oracle   20777     1  0 15:59 ?        00:00:00 ora_dbw7_bench1
oracle   20763     1  3 15:59 ?        00:00:32 ora_dbw0_bench1
oracle   20765     1  3 15:59 ?        00:00:32 ora_dbw1_bench1
oracle   20767     1  3 15:59 ?        00:00:32 ora_dbw2_bench1
oracle   20769     1  3 15:59 ?        00:00:32 ora_dbw3_bench1
oracle   20771     1  3 15:59 ?        00:00:32 ora_dbw4_bench1
oracle   20773     1  3 15:59 ?        00:00:32 ora_dbw5_bench1
oracle   20775     1  3 15:59 ?        00:00:32 ora_dbw6_bench1
oracle   20777     1  3 15:59 ?        00:00:32 ora_dbw7_bench1

So here again the DBWR workload would “fit” within a single CPU. With this configuration, the OLTP throughput was 57.9 TPM. How does that compare to the same workload running against an instance with a single DBWR process?

Heavy OLTP Load, db_writer_processes=1
The following ps(1) output shows that a single DBWR process was able to service the same OLTP load with 291 CPU seconds-still much less (32%) than the bandwidth of a single CPU (there are 900 CPU seconds per core during the test).

$ grep ora_db noh*
oracle   21426     1  0 16:26 ?        00:00:00 ora_dbw0_bench1
oracle   21426     1 29 16:26 ?        00:04:51 ora_dbw0_bench1

But what about performance? When reducing DBWR count to 1, the OLTP throughput increased 8% from 57.9 to 62.6 TPM. What was the I/O load like though? Here is a snippet from statspack:

Load Profile                            Per Second       Per Transaction
~~~~~~~~~~~~                       ---------------       ---------------
                  Redo size:          5,918,344.96              4,355.71
              Logical reads:            125,684.76                 92.50
              Block changes:             33,622.21                 24.74
             Physical reads:              2,066.64                  1.52
            Physical writes:              8,483.06                  6.24
                 User calls:             21,996.51                 16.19
                     Parses:              6,737.41                  4.96
                Hard parses:                  0.27                  0.00
                      Sorts:                  1.03                  0.00
                     Logons:                  0.00                  0.00
                   Executes:             18,852.22                 13.87
               Transactions:              1,358.76

We see that with a single DBWR, the OLTP workload pushed through some 10,549 IOPS of which 8,483 per second were writes. That means a single DBWR on fairly outdated AMD Opteron processors (DL585) can service 8,483 writes per second with only 32% of a single CPU. So why configure more than that?

Where Did The Time Go?
Were there any significant waits on the 8 DBWR case? Yes, there were. Let’s see if anyone can guess which one is which:

Top 5 Timed Events                                                    Avg %Total
~~~~~~~~~~~~~~~~~~                                                   wait   Call
Event                                            Waits    Time (s)   (ms)   Time
----------------------------------------- ------------ ----------- ------ ------
CPU time                                                     3,148          35.8
log file sync                                1,207,863       2,905      2   33.1
log file switch (checkpoint incomplete)          4,627         828    179    9.4
db file scattered read                         172,724         670      4    7.6
log file parallel write                        532,373         464      1    5.3
          -------------------------------------------------------------

Top 5 Timed Events                                                    Avg %Total
~~~~~~~~~~~~~~~~~~                                                   wait   Call
Event                                            Waits    Time (s)   (ms)   Time
----------------------------------------- ------------ ----------- ------ ------
CPU time                                                     2,858          31.0
log file sync                                1,076,670       2,509      2   27.2
log file switch (checkpoint incomplete)          4,808       1,939    403   21.0
db file scattered read                         173,566         664      4    7.2
log file parallel write                        491,346         419      1    4.5
          -------------------------------------------------------------

Summary
Did he really make this long of a blog entry to discuss some 8% OLTP throughput increase? Well, yes and no. The affect of processor-cache thrashing will be more severe on larger SMP systems. This test system only has 4 sockets (8 cores). I’ve seen crazy DBWR configurations on 32 and 64 CPU systems account for more than 8%. Even if 8% was a constant, who wants to lose as much as 3 or 5 CPUs worth of bandwidth in today’s IT environment?


Learn How To Obliterate Processor Caches: Configure Lots and Lots of DBWR Processes. Part I.

Oracle8 introduced true multiple DBWR processes configured with the db_writer_processes parameter. I remember that the maximum value one could set this to back then was 10. Oracle8i raised that limit I recall. These are processes that build their own write batches (scan LRUs, modify cache buffers chains structs, etc) and perform their own I/O (synchronously or asynchronously). They also post (e.g., semop(2) on most platforms) processes waiting in free buffer wait. Originally, multiple true DBWR processes were implemented to support NUMA system that needed processes local to memory and I/O cards to flush buffers-thus eliminating remote I/O operations.

On systems with flat memory systems (non-NUMA) the only reason to implement multiple DBWR processes is if a single DBWR is processor bound. Such a condition is simple to detect because your free buffer waits will shoot through the roof and a cursory glance at top(1) will show DBWR pegged to the top.

I was just giving this NetApp paper a quick read and found the following absolute rule on page 9:

Async I/O is now recommended on all the storage protocols. The recommended value for db_writers_processes is to at least match the number of processor cores on the system.

Beside the fact that the author misspelled the initialization parameter db_writer_processes, this is not very good advice at all. I wouldn’t be as critical if they were to have recommended a DBWR process per socket bound via taskset(1), but one per core just floating around is going to impact L2 caches. The way this works is that the number of cache buffers LRUs are split amongst the DBWR processes. Each DBWR process will maintain a set of LRUs so even with a light amount of flushing, the work will be spread across the DBWR processes. Here is an absolute: Never break up a workload that can be satisfied with a single processor and force it to be distributed across multiple CPUs. When you do that you simply increase the scheduling overhead and increase the amount of work that is done cache-cold (L2). That is, lightly tasked DBWR processes are more likely to get scheduled on CPUs they haven’t recently run on-thus they are cache cold.

I don’t expect anyone to just take my word for it-although it would be nice if at least some did. I do get tired of proving fact that dates back to the mid-1990s. Ugh, that sounded grumpy, sorry. I’ll see if I can’t push a run through and provide some performance data for a pathological (1 per core, no affinity) versus 1 through 1-per-core with affinity. I haven’t done that in a while. It’ll be fun..yippie.

Summary
If anyone gives you an absolute, ignore it. That includes me. As sure as I’m sitting here I will get at least two emails on this topic. One will tell me that they increased db_writer_processes and “got a performance boost.” The other will tell me to remember that sometimes man bites dog.

Fundamentally, however, a single DBWR process on a flat-memory SMP given kernel async I/O, ample scheduling priority, non-preemption on ports that support it, and ample CPU cycles will be able to keep the SGA clean. If any of these criteria are not met then throwing another DBWR at the situation should help, but that is entirely different than starting with 1 per core.

DBWR with CIO on JFS2. Resource Starvation?

In a recent post to the oracle-l email list, a participant posted the following:

We are running Oracle 9.2.0.7 & 10.2.0.2 on Aix 5.2.  I am seeing the following warnings in the DB Writer trace file:

Warning: lio_listio returned EAGAIN
Performance degradation may be seen.

There have been several very interesting threads on the list lately about Oracle on AIX with JFS2 filesystems. I’d like to blog quickly about this thread.

The error message in the DBWR trace file indicates that lio_listio() calls are being starved for resources, but what resources?

A lio_listio() Backgrounder
The error message in the DBWR trace file indicates that lio_listio() calls are being starved for resources. For those who don’t know, lio_listio() is the traditional POSIX gathered write system call. Most Oracle ports use it. It supports DBWR’s need to flush multiple buffers to multiple files in one call, but completion processing is a little rough. The way the call works is your program (e.g., DBWR) either issues a long list of requests and blocks until they are all done (mode=LIO_WAIT), or the mode argument is set to LIO_NWAIT which means your process can continue to do other work. When all the LIO_NWAIT requests are completed, your process gets delivered a signal also specified at call time. So, if for some reason, DBWR is doing a lot of small burst writes, it will likely be handling a lot of signals. No big deal really, but that is how it works. The way I/O completion handling works with POSIX AIO is one of the main reasons Oracle was motivated to define the Oracle Disk Manager library specification(ODM).  The differences between ODM and POSIX AIO is a topic for a different blog entry.

About lio_listio() on Filesystem Files
Details, details. The way AIO is implemented from one filesystem to the next varies greatly—unfortunately. I prefer simplicity and that is why the cluster filesystem coupled with PolyServe Matrix Server supports the same Linux kernel internals for AIO as are exercised when using raw devices. If you mount a PSFS in DBoptimized mode, calls to lio_listio(3) are met with the same kernel handling as if the call was targeting raw partitions. But, this blog entry is not about PolyServe since the oracle-l post was about Oracle9i and Oracle10g on AIX.

AIO on JFS2
So, I sent an email to the poster to make sure that this error was being hit on JFS2 and he confirmed it was. You see, AIO on JFS2 is handled by kernel processes of which there are only 10 per processor by default. The number of system wide AIO in flight is limited by the number of these AIO “handlers” as specified in IBM’s AIO documentation (see maxervers). To get around this lio_listio() error, more AIO kernel processes are needed, but how many? That IBM documenation suggests:

The value should be about the same as the expected number of concurrent AIO requests.

How Many is Enough. How Many is Too Many?
Hmmm, that is going to be a very difficult number to guess for the original poster who had both 9i and 10g running on the same pSeries server. Remember, there is no way to control DBWR. If you have a really dirty SGA, DBWR will do really large write batches. That is a good thing.  

In cases like this I tend to generally work out what safe ceilings are. I know Bret Olszewski and if he gives a reasonable value for a tunable, I tend to take his word. In this paper about database performance on JFS, Bret and his co-authors state:

[…] the number of aioservers in the system limits the number of asynchronous I/O operations that can be in progress simultaneously. The maximum number of aioservers that can be created is controlled by the maxservers attribute, which has a default value of 10 per processor. For our experiments, we used a maxservers value of 400 per processor.

The paper also points out that there are 4 CPUs in the System p 680 test system. So while the default is 10 per CPU, it looks like if the collective DBWR in-flight I/O are bursting at high rates—such as as 1600 concurrent I/Os—setting aioservers to 400 per processor is not unreasonable.

The paper also covers a technique used to determine if you have too many aioservers. Basically, if you have a bunch of these kernel processes that do not get CPU time then the I/O load is sufficiently being handled by the processes that are burning CPU. You can then reduce the number if it seems important to you. Makes sense, but I can’t imagine having sleeping kernel processes around costs much.

A Word About Filesystem Performance
OK, if Bret specifies a tunable, I take his advice. On the other hand, I have to call out a problem in that JFS2 paper. In the analysis section, the conclusion is that Concurrent I/O performs 200% better than plain Direct I/O, and comes within 8% of raw logical volumes.That makes sense since CIO implicitly invokes DIO and DIO should be as fast as raw disk with the exception of write serialization (which CIO addresses). The test was 100% processor bound and I/O intensive so any processor overhead in the I/O code path will account for that 8%–there is, after all, more software in the filesystem case than the raw logical volume case but is it really code path that costs the 8 percent? The paper states:

The Concurrent I/O run has a higher %system and lower %user than the raw LV run because of the additional context switches due to traversing down the file system path for I/O, and due to the use of AIO server threads for servicing AIO requests […]

OK, the bit about “additional context switches due to traversing down the file system path” is really weird. There is no such thing unless you are opening files for every I/O—which, of course, Oracle does not do. Oracle keeps files open and I/O is nothing more than a position and read/write  (e.g., pread(), pwrite()) or an asynchronous write (e.g., lio_listio()).  It is true that converting a pathname to an inode costs (e.g., the namei()/lookup() kernel routines), but that is paid in the open(2) call. Once a file is open there is no cost associated with the pathname because I/O routines do not even use a pathname—they use the file descriptor. In short,  there is no “traversing down the file system path” associated with I/O on an open file. If I had $50 to bet, I would wager the 1600 AIO handlers jumping on and off those 4 CPUs would account for the 8%, but what do I know?


Using OProfile to Monitor Kernel Overhead on Linux With Oracle

Yes, this Blog post does have OProfile examples and tips, but first my obligatory rant…

When it comes to Oracle on clustered Linux, FUD abounds.  My favorite FUD is concerning where kernel mode processor cycles are being spent. The reason it is my favorite is because there is no shortage of people that likely couldn’t distinguish between a kernel mode cycle and a kernel of corn hyping the supposed cost of running Oracle on filesystem files—especially cluster filesystems. Enter OProfile.

OProfile Monitoring of Oracle Workloads
When Oracle is executing, the majority of processor cycles are spent in user mode. If, for instance, the processor split is 75/25 (user/kernel), OProfile can help you identify how the 25% is being spent. For instance, what percentage is spent in process scheduling, kernel memory management, device driver routines and I/O code paths.

System Support
The OProfile website says:

OProfile works across a range of CPUs, include the Intel range, AMD’s Athlon and AMD64 processors range, the Alpha, ARM, and more. OProfile will work against almost any 2.2, 2.4 and 2.6 kernels, and works on both UP and SMP systems from desktops to the scariest NUMAQ boxes.

Now, anyone that knows me or has read my blog intro knows that NUMA-Q meant a lot to me—and yes, my Oak Table Network buddies routinely remind me that I still haven’t started attending those NUMA 12-step programs out there. But I digress.

Setting Up OProfile—A Tip
Honestly, you’ll find that setting up OProfile is about as straight forward as explained in the OProfile documentation. I am doing my current testing on Red Hat RHEL 4 x86_64 with the 2.6.9-34 kernel. Here is a little tip: one of the more difficult steps to getting OProfile going is finding the right kernel-debug RPM. It is not on standard distribution medium and hard to find—thus the URL I’ve provided. I should think that most people are using RHEL 4 for Oracle anyway.

OProfile Examples
Perhaps the best way to help get you interested in OProfile is to show some examples. As I said above, a very important bit of information OProfile can give you is what not to worry about when analyzing kernel mode cycles associated with an Oracle workload. To that end, I’ll provide an example I took from one of my HP Proliant DL-585’s with 4 sockets/8 cores attached to a SAN array with 65 disk drives. I’m using an OLTP workload with Oracle10gR2 and the tablespaces are in datafiles stored in the PolyServe Database Utility for Oracle; which is a clustered-Linux server consolidation platform. One of the components of the Utility is the fully symmetric cluster filesystem and that is where the datafiles are stored for this OProfile example. The following shows a portion of a statpack collected from the system while OProfile analysis was conducted.

NOTE: Some browsers require you to right click->view to see reasonable resolution of these screen shots

spack


As the statspack shows, there were nearly 62,000 logical I/Os per second—this was a very busy system. In fact, the processors were saturated which is the level of utilization most interesting when performing OProfile. The following screen shot shows the set of OProfile commands used to begin a sample. I force a clean collection by executing the oprofile command with the –deinit option. That may be overkill, but I don’t like dirty data. Once the collection has started I run vmstat(8) to monitor processor utilization. The screen shot shows that the test system was not only 100% CPU bound, but there were over 50,000 context switches per second. This, of course, is attributed to a combination of factors—most notably the synchronous nature of Oracle OLTP reads and the expected amount of process sleep/wake overhead associated with DML locks, background posting and so on. There is a clue in that bit of information—the scheduler must be executing 50,000+ times per second. I wonder how expensive that is? We’ll see soon, but first the screen shot showing the preparatory commands:

opstart

So the next question to ask is how long of a sample to collect. Well, if the workload has a “steady state” to achieve, it is generally sufficient to let it get to that state and monitor about 5 or 10 minutes. It does depend on the ebb and flow of the workload. You don’t really have to invoke OProfile before the workload commences. If you know your workload well enough, watch for the peak and invoke OProfile right before it gets there.

The following screen shot shows the oprofile command used to dump data collected during the sample followed by a simple execution of the opreport command.


opdump


OK, here is where it gets good. In the vmstat(8) output above we see that system mode cycles were about 20% of the total. This simple report shows us a quick sanity check. The aggregate of the core kernel routines (vmlinux) account for 65% of that 20%–13% of all processor cycles. Jumping over the cost of running OProfile (23%) to the Qlogics Host Bus Adaptor driver we see that even though there are 13,142 IOPS, the device driver is handling that with only about 6% of system mode cycles—about 1.2% of all processor cycles.

The Dire Cost of Deploying Oracle on Cluster Filesystems
It is true that Cluster Filesystems inject code in the I/O code path. To listen to the FUD-patrol, you’d envision a significant processor overhead. I would if I heard the FUD and wasn’t actually measuring anything. As an example, the previous screen shot shows that by adding the PolyServe device driver and PolyServe Cluster Filesystem modules (psd, psfs) together there is 3.1% of all kernel mode cycles (.6% of all cycles) expended in PolyServe code—even at 13,142 physical disk transfers per second. Someone please remind me the importance of using raw disk again? I’ve been doing performance work on direct I/O filesystems that support asynchronous I/O since 6.0.27 and I still don’t get it. Anyway, there is more that OProfile can do.

The following screen shot shows an example of getting symbol-level costing. Note, I purposefully omitted the symbol information for the Qlogic HBA driver and OProfile itself to cut down on noise. So, here is a trivial pursuit question: what percentage of all processor cycles does RHEL 4 on a DL-585 expend in processor scheduling code when the system is sustaining some 50,000 context switches per second? The routine to look for is schedule() and the following example of OProfile shows the answer to the trivial pursuit question is 8.7% of all kernel mode cycles (1.7% of all cycles).

sym1

The following example shows me where PolyServe modules rank in the hierarchy of non-core kernel (vmlinux) modules. Looks like only about 1/3rd the cost of the HBA driver and SCSI support module combined.

sym2

If I was concerned about the cost of PolyServe in the stack, I would use the information in the following screen shot to help determine what the problem is. This is an example of per-symbol accounting. To focus on the PolyServe Cluster Filesystem, I grep the module name which is psfs. I see that the component routines of the filesystem such as the lock caching layer (lcl), cluster wide inode locking (cwil) and journalling are evenly distributed in weight—no “sore thumbs” sticking up as they say. Finally, I do the same analysis for our driver, PSD, and there too see no routine accounting for any majority of the total.

sym3

Summary
There are a couple of messages in this blog post. First, since tools such as OProfile exist, there is no reason not to actually measure where the kernel mode cycles go. Moreover, this sort of analysis can help professionals avoid chasing red herrings such as the fairy tales of measurable performance impact when using Oracle on quality direct I/O cluster filesystems. As I like to say, “Measure before you mangle.” To that end, if you do find yourself in a situation where you are losing a significant amount of your processor cycles in kernel mode, OProfile is the tool for you.

Using Oracle Disk Manager to Monitor Database I/O

Some of the topics in this post are also covered in the Julian Dyke/Steve Shaw RAC book that came out last summer. I enjoyed being one of the technical reviewers of the book. It is a good book.

Monitoring DBWR Specifically
I have received several emails from existing PolyServe customers asking me why I didn’t just use the Oracle Disk Manager (ODM) I/O monitoring package that is included in the PolyServe Database Utility for Oracle to show the multi-block DBWR writes I blogged about in this post. After all, there is very little left to the imagination when monitoring Oracle using this unique feature of our implementation of the Oracle Disk Manager library specification.

This URL will get you a copy of the I/O Monitoring feature of our Oracle Disk Manager library. It is quite a good feature.

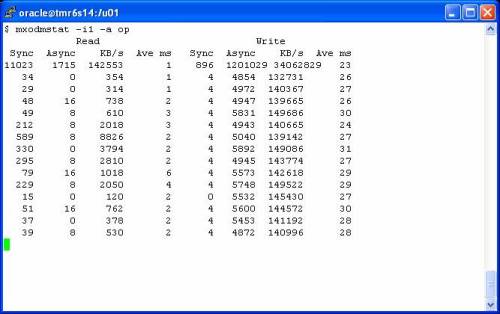
I didn’t use ODM for the first part of that thread because I wanted to discuss using strace(1) for such purposes. Yes, I could have just used the mxodmstat(1) command that comes with that package and I would have seen that the average I/O size was not exactly db_block_size as one would expect. For instance, the following screen shot is an example of cluster wide monitoring of DBWR processes. The first invocation of the command is used to monitor DBWR only followed by another execution of the command to monitor LGWR. The average size of the async writes for DBWR are not precisely 8KB (the db_block_size for this database) as they would be if this was Oracle9i:

NOTE: You may have to right click->view the screen shot

dom1

As an aside, the system was pretty busy as the following screen shot will show. This is a non-RAC database on an HP Proliant DL-585 where database writes are peaking at roughly 140MB/s. You can also see that the service times (Ave ms) for the writes are averaging a bit high (as high as 30ms). Looks like I/O subsystem saturation.

odm2


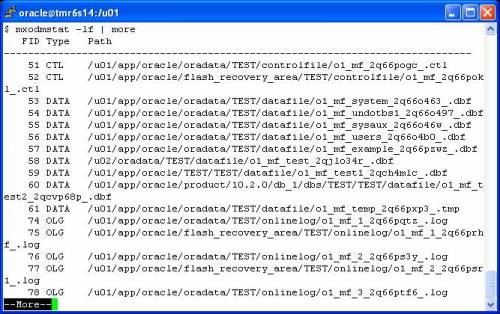
Oh, here’s a quick peek at one nice feature of mxodmstat(1). You can dump out all the active files, clusterwide, for any number of database/instances and nodes using the –lf options:

odm3

I hope you take peek at the User Guide for this feature. It has a lot of examples of what the tool can do. You might find it interesting—perhaps something you should push your vendor to implement?


Analyzing Oracle10g Database Writer I/O Activity on Linux

Using strace(1) to Study Database Writer on Linux
This is a short blog entry for folks that are interested in Oracle10g’s usage of libaio asynchronous I/O routines (e.g., io_submit(2)/io_getevents(2)). For this test, I set up Oracle10g release 10.2.0.1 on Red Hat 4 x86_64. I am using the cluster filesystem bundled with the PolyServe’s Database Utility for Oracle, but for all intents and purposes I could have used ext3.

The workload is a simple loop of INSERT INTO SELECT * FROM statements to rapidly grow some tables thereby stimulating Database Writer (DBWR) to flush modified SGA buffers to disk. Once I got the workload running, I simply executed the strace command as follows where <DBWR_PID> was replaced with the real PID of the DBWR process:

$ strace -o dbw -p <DBWR_PID>

NOTE: Using strace(1) imposes a severe penalty on the process being traced.  I do not recommend using strace(1) on a production instance unless you have other really big problems the strace(1) output would help you get under control.

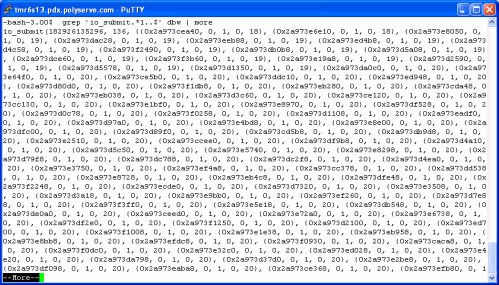
The second argument to the io_submit(2) call is a long integer that represents the number of I/O requests spelled out in the current call. The return value to an io_submit(2) call is the number of iocb’s processed. One clever thing to do is combine grep(1) and awk(1) to see what degree of concurrent I/O DBWR is requesting on each call. The following screen shot shows an example of using awk(1) to select the io_submit(2) calls DBWR has made to request more than a single I/O. All told, this sould be the majority of DBWR requests.

NOTE: You may have to right click->view the image. Some readers of this blog have reported this. Sorry

strace 1

Another way to do this is to anchor on the return to the io_submit(2) call. The following screen shot shows an example of grep(1) to selecting only the io_submit(2) calls that requested more than 100 I/O transfers in a single call.

strace 2

What File Descriptors?
When io_submit(2) is called for more than one I/O request, the strace(1) output will string out details of each individual iocb. Each individual request in a call to io_submit(2) can be for a write to a different file descriptor. In the following text grep(1)ed out of the strace(1) output file, we see that Oracle requested 136 I/Os in a single call and the first 2 iocbs were requests to write on file descriptor 18.:

io_submit(182926135296, 136, {{0x2a973cea40, 0, 1, 0, 18}, {0x2a973e6e10, 0, 1, 0, 18}

What About ASM?
You can run ASM with libaio. If you do, you can do this sort of monitoring, but you wont really be able to figure out what DBWR is writing to because the file descriptors will just point to raw disk. ASM is raw disk.


Network Appliance OnTap GX for Oracle? Clustered Name Space. A Good User Group (OSWOUG)

Presenting NAS Architecture at OSWOUG
I had a speaking session recently at OSWOUG about NAS architectures as pertaining to Oracle. It was a good group, and I enjoyed the opportunity to speak there. The presentation was an “animated” digest of this paper and covers:

  • single-headed filers
  • clustered single-headed filers
  • asymmetrical multi-headed NAS
  • symmetrical multi-headed NAS

Symmetric NAS versus Clustered Name Space
Since the only model in existence for the symmetrical multi-headed NAS architecture is the HP Enterprise File Services Clustered Gateway (which is an OEMed version of the PolyServe File Serving Utility), I spent some time discussing the underpinnings—the cluster filesystem. At one point I spent just a few moments discussing Cluster Name Space technology, but I wish I had taken it further. I’ll make up for it now.

If You Can’t Cluster Correctly, At Least Cluster Something
Something is better than nothing, right? Many years ago, an old friend of mine was coming back from duty in Antarctica on a coast guard ice cutter. You’d have to know Kenny to get the full picture but at one point, over beer, he pulled out a phrase that still makes me chuckle. I don’t remember the context, but his retort to some rant I was on was, “Well, if you can’t tie a knot, tie a lot”. That, my friends, is the best way to sum up Cluster Name Space NAS technology. I couldn’t find a dictionary definition, so I’ll strike a claim:

clus·ter name space'klus-ter 'nAm 'spAs
n.

Software technology which when applied to separate storage devices gives the illusion of scalable filesystem presentation. Cluster name space technology is a filesystem directory aggregator. Files stored in a directory in a cluster name space implementation cannot span the underlying storage devices. Single large files cannot benefit from cluster name space technology. Cluster name space is commonly referred to by the acronym CNS. When applied to Oracle databases, CNS forces the physical partitioning of data across the multiple, aggregated underlying storage devices.

v.

To apply a virtualized presentation layer to a bottlenecked storage architecture: “hey, let’s just CNS it and ship it”

The verb form of the term was demonstrated when Network Appliance bought Spinnaker back in 2003. When you spend 300 million dollars on technology, what is done with it often winds up looking more like a verb than a noun. What do I mean by that? There is nothing about Network Appliance’s OnTap GX technology that was built from the ground up to be clustered and scalable. Network Appliance has had clustered filers for a long time. That doesn’t mean the data in the filers is clustered. It is merely a cabling exercise. What they did between the 2003 purchase of Spinnaker and the release of OnTap GX was a verb—they CNSed their existing technology. I can tell from the emails I get that there are about 42 of you who think I make all this stuff up. Let’s get it from the horse’s mouth, quoting from page 8 of this NetApp whitepaper covering OnTap GX:

When an NFS request comes to a Data ONTAP GX node, if the requested data is local to the node that receives the request [reference removed], that node serves the file. If the data is not local [reference removed], the node routes the request over the private switched cluster network to the node where the data resides. That node then forwards the requested data back to the requesting node to be forwarded to the client.

Perhaps a picture can replace a thousand words. Nobody, not even in the deepest, darkest, remote areas of the Amazon rain forest would mistake what is depicted in the following graphic for a symmetrical file serving technology:

spinnaker4

The Press
There has been a lot of press coverage of Data OnTap GX (NetApp is the poster child for CNS), and most articles get the technology just flat wrong. This techtarget.com article, on the other hand gets it quite right:

NetApp’s SpinServer is a clustered file system for NFS that currently doesn’t support CIFS. SpinServer exports a single namespace across all storage nodes, but files aren’t striped across nodes

And so does this techtarget.com article which exposes the weakness of the CNS verb situation:

…immediately found a problem with the high-availability (HA) failover detection system. A failure could be bad enough that clients could not access data but not bad enough to alert the system.

What Does This Have To Do With Oracle?
OK, this is a blog about Oracle and storage. Let me interpret the quote from NetApp’s paper covering Data OnTap GX. If you have a large Oracle datafile that gets hammered with I/O this technology will do absolutely nothing to improve your throughput or reduce I/O latencies. A single file is contained within one filer’s storage and thus, represents an I/O throughput bottleneck. One of the sites I read, DrunkenData, has a thread on this topic. It appears as though the thread is aimed at trying to believe in something more than to understand something, but my assessment could be wrong.

The CNS topic is quite simple; the word “cluster” in the CNS context has nothing to do with file-level scalability. Yes, I know Network Appliance is a multi-billion dollar corporation so I’m sure my exposé of this topic will be met with nefarious men wearing trench coats lying in wait to attack…

Cram Some Technology into Your Solution
This storagemagazine.techtarget.com article covers some clustered NAS topics, but there was one bit in there that stood out when I read it and I’d like to comment. The following excerpt recommends CNS technology for Oracle:

…To avoid this problem, consider a global namespace product…The only way to implement a cross-platform global namespace is to replace your NAS infrastructure with, for example, NetApp’s SpinServer or Panasas’ ActiveScale. If Oracle 10 on a Linux cluster is in your future, then the NetApp and Panasas solutions should be on your short list.

Bad mojo! I have said many times before that Oracle on NAS is a good model and NetApp is obviously the 800lb gorilla in this space. However, I disagree with the idea posted in this quoted article for two reasons. First, Oracle uses large files and CNS does not scale single large files. To get the benefit of CNS, you will have to partition your large files into smaller ones so as to get multiple filers serving the data. If you wanted to physically partition your data, you would have chosen a different database technology like DB2 EEE. And secondly, Oracle has an established program for NAS vendors to certify their capabilities with Oracle databases. Panasas may be good technology, but since it is not an OSCP vendor, it doesn’t get to play with Oracle. On the other hand, the HP EFS-CG, which is multi-headed and scalable, is. Fair is Fair.

A Change of Heart
Here was an interesting post in the bioinformatics.org mailing list about “global name space”. I don’t know how the different filesystem technologies got clumped together as they did, but that was two years ago. I found it interesting that the poster was from Verari Systems who now resell the PolyServe File Serving Utility.

Summary
I hope you know more now about CNS than you would ever care to know–literally.


DISCLAIMER

I work for Amazon Web Services. The opinions I share in this blog are my own. I'm *not* communicating as a spokesperson for Amazon. In other words, I work at Amazon, but this is my own opinion.

Enter your email address to follow this blog and receive notifications of new posts by email.

Join 747 other subscribers
Oracle ACE Program Status

Click It

website metrics

Fond Memories

Copyright

All content is © Kevin Closson and "Kevin Closson's Blog: Platforms, Databases, and Storage", 2006-2015. Unauthorized use and/or duplication of this material without express and written permission from this blog’s author and/or owner is strictly prohibited. Excerpts and links may be used, provided that full and clear credit is given to Kevin Closson and Kevin Closson's Blog: Platforms, Databases, and Storage with appropriate and specific direction to the original content.

%d bloggers like this: