A new user to pgio (The SLOB Method for PostgreSQL) reached out to me with the following comment:
I’ve been testing with pgio but when I compare I/O monitored in iostat output it does not match the pgio output for physical reads.
The user is correct–but that’s not the fault of pgio. Please allow me to explain.
Buffering Buffers, and Baffles
PostgreSQL does not open files with the O_DIRECT flag which means I/O performed by PostgreSQL is buffered I/O. The buffering uses physical memory in the Linux page cache. For this reason, the pgio runit.sh script produces output that accounts for read IOPS (RIOPS) as opposed to RPIOPS (Read Physical IOPS). The following is an example of what the user reported and how to change the behavior.
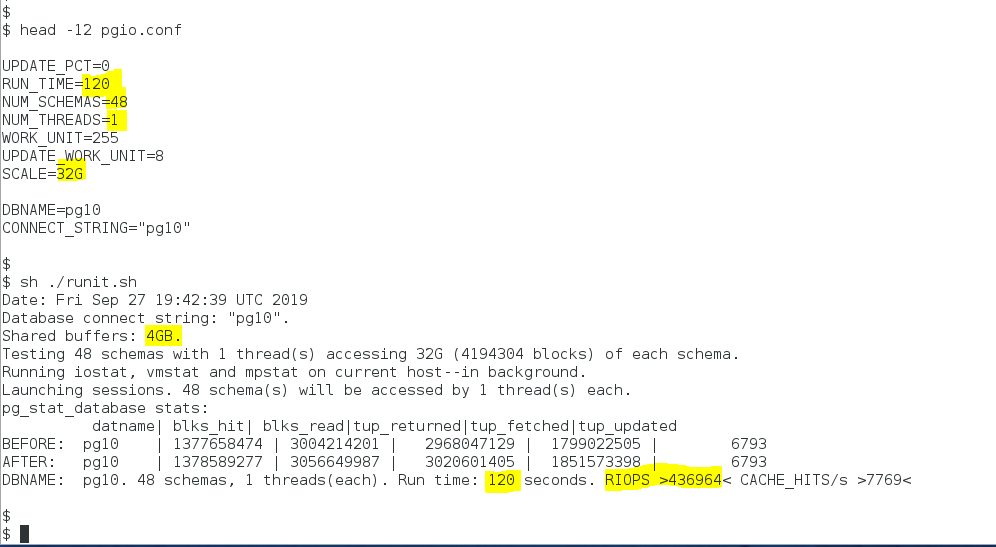
The output in Figure 1 shows how I set up a 48-schema (32GB each) test with a single pgio thread accessing each schema. The output of runit.sh shows that the PostgreSQL primary cache (shared memory) is 4GB and that at the end of the 120 second test the internal PostgreSQL counters tallied up 436,964 reads from storage per second (RIOPS).

Figure 1
The test configuration for this has NVMe drives assembled into a single logical volume with mdadm(4) called /dev/md0. The pgio runit.sh driver script saves iostat(1) output. Figure 2 shows the iostat report for physical read requests issued to the device. A simple glance reveals the values cannot average up to 436,964 as reported by runit.sh. That’s because runit.sh isn’t reporting physical reads from storage.

Figure 2
As shown in Figure 3, pgio saves the output of /proc/diskstats. The most accurate way to calculate physical accesses to storage by pgio is to calculate the delta between the before and after data in the pgio_diskstats.out file. The diskstats data shows that the true physical read IOPS rate was 301,599 not the 436,964 figure reported by runit.sh. Again, this is because runit.sh reports reads, not physical reads and that is because PostgreSQL doesn’t really know whether a read operation is satisfied with a page cache buffer hit or a physical access to the storage device. Also shown in Figure 3 is how the data in iostat.out and diskstats output are within .1%.

Figure 3
So, let’s see how we can change this behavior.
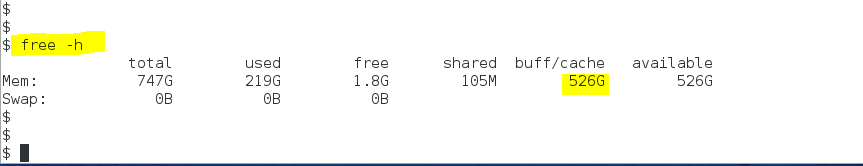
Figure 4 shows that the 436,964 read results were achieved on a system that can buffer 526GB of the pgio active data set.

Figure 4
If You Don’t Want To Test Buffered I/O, Don’t
Figure 5 shows an example of using the pgio_reduce_free_memory.sh script to limit the amount of memory available to page cache. For no particular reason, I chose to limit page cache to less than 16GB and then executed the pgio test again. As Figure 5 shows, the effect of neutering page cache buffering brought the RIOPS figure and both the iostat and diskstat data to within 1% variation.

Figure 5
Summary
This post shows that that PostgreSQL performs buffered I/O and that the pgio runit.sh driver script reports read iops (RIOPS) as per PostgreSQL internal statistics. Since pgio includes a helper script to eliminate page cache buffering from your testing, you too can test physical I/O with pgio and have accurate accounting of that physical I/O by analyzing the /proc/diskstats and iostat(1) data saved by the runit.sh script.


Recent Comments