Archive Page 36

The 60% Allocation “Rule.” Oracle TPC-H Proves Hard Drives Are Still Round!

I recently blogged about the phenomenal Oracle10g TPC-H result with HP’s Itanium2 based Superdome. I just took another look at the Full Disclosure Report to see what percentage of the gross disk capacity was used for Oracle tablespaces. When allocating space from each spindle, it is always good practice to use no more than about the outer most 60% of the platters. The sectors on the outside of each platter have higher capacity than the sectors closer to the center. I know not all storage arrays allow administrators to choose the disk geometry that derives a LUN, but if it is supported, it is good practice.

The 60% Rule Lives On
This audacious TPC-H result used 3072 36GB hard drives. Yes, folks, unfortunately for databases like Oracle more small drives are better—yet most of today’s storage arrays are shipping maximum capacity with minimum spindles. Yikes! Anyway, a storage configuration with 3072 36GB drives yields a gross capacity of 108TB. As I discussed in my first post about this TPC-H results, the ASM diskgroup consisted of 256 “disks” which were actually 138GB LUNs—an ASM diskgroup of 34.5TB. Since ASM was used with external redundancy, it is safe to presume that the LUNs were mirrored so the 108TB gross yields a RAID net of 54TB. The ASM space, therefore, consumed 63.8% of the drives’ gross capacity.

Some Things Never Change
Good fundamental principles such as preferring the outer portions of those round, brown spinning things generally stand the test of time. The storage subsystem configured for this TPC-H result prices out at nearly USD $3 million and yet the same fundamental storage allocation rules are still followed.

Audited TPC results are a wealth of information. I sure used to loathe doing them though!

Using OProfile to Monitor Kernel Overhead on Linux With Oracle

Yes, this Blog post does have OProfile examples and tips, but first my obligatory rant…

When it comes to Oracle on clustered Linux, FUD abounds.  My favorite FUD is concerning where kernel mode processor cycles are being spent. The reason it is my favorite is because there is no shortage of people that likely couldn’t distinguish between a kernel mode cycle and a kernel of corn hyping the supposed cost of running Oracle on filesystem files—especially cluster filesystems. Enter OProfile.

OProfile Monitoring of Oracle Workloads
When Oracle is executing, the majority of processor cycles are spent in user mode. If, for instance, the processor split is 75/25 (user/kernel), OProfile can help you identify how the 25% is being spent. For instance, what percentage is spent in process scheduling, kernel memory management, device driver routines and I/O code paths.

System Support
The OProfile website says:

OProfile works across a range of CPUs, include the Intel range, AMD’s Athlon and AMD64 processors range, the Alpha, ARM, and more. OProfile will work against almost any 2.2, 2.4 and 2.6 kernels, and works on both UP and SMP systems from desktops to the scariest NUMAQ boxes.

Now, anyone that knows me or has read my blog intro knows that NUMA-Q meant a lot to me—and yes, my Oak Table Network buddies routinely remind me that I still haven’t started attending those NUMA 12-step programs out there. But I digress.

Setting Up OProfile—A Tip
Honestly, you’ll find that setting up OProfile is about as straight forward as explained in the OProfile documentation. I am doing my current testing on Red Hat RHEL 4 x86_64 with the 2.6.9-34 kernel. Here is a little tip: one of the more difficult steps to getting OProfile going is finding the right kernel-debug RPM. It is not on standard distribution medium and hard to find—thus the URL I’ve provided. I should think that most people are using RHEL 4 for Oracle anyway.

OProfile Examples
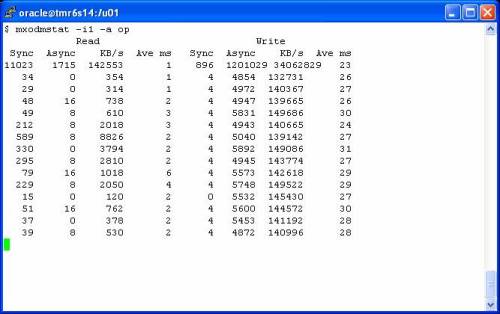
Perhaps the best way to help get you interested in OProfile is to show some examples. As I said above, a very important bit of information OProfile can give you is what not to worry about when analyzing kernel mode cycles associated with an Oracle workload. To that end, I’ll provide an example I took from one of my HP Proliant DL-585’s with 4 sockets/8 cores attached to a SAN array with 65 disk drives. I’m using an OLTP workload with Oracle10gR2 and the tablespaces are in datafiles stored in the PolyServe Database Utility for Oracle; which is a clustered-Linux server consolidation platform. One of the components of the Utility is the fully symmetric cluster filesystem and that is where the datafiles are stored for this OProfile example. The following shows a portion of a statpack collected from the system while OProfile analysis was conducted.

NOTE: Some browsers require you to right click->view to see reasonable resolution of these screen shots

spack


As the statspack shows, there were nearly 62,000 logical I/Os per second—this was a very busy system. In fact, the processors were saturated which is the level of utilization most interesting when performing OProfile. The following screen shot shows the set of OProfile commands used to begin a sample. I force a clean collection by executing the oprofile command with the –deinit option. That may be overkill, but I don’t like dirty data. Once the collection has started I run vmstat(8) to monitor processor utilization. The screen shot shows that the test system was not only 100% CPU bound, but there were over 50,000 context switches per second. This, of course, is attributed to a combination of factors—most notably the synchronous nature of Oracle OLTP reads and the expected amount of process sleep/wake overhead associated with DML locks, background posting and so on. There is a clue in that bit of information—the scheduler must be executing 50,000+ times per second. I wonder how expensive that is? We’ll see soon, but first the screen shot showing the preparatory commands:

opstart

So the next question to ask is how long of a sample to collect. Well, if the workload has a “steady state” to achieve, it is generally sufficient to let it get to that state and monitor about 5 or 10 minutes. It does depend on the ebb and flow of the workload. You don’t really have to invoke OProfile before the workload commences. If you know your workload well enough, watch for the peak and invoke OProfile right before it gets there.

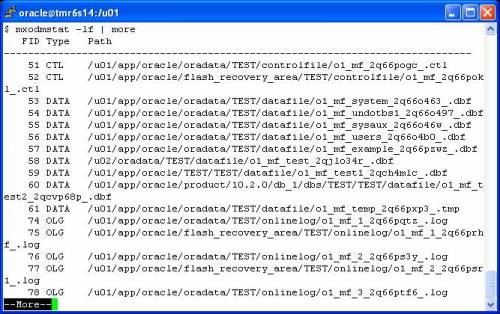
The following screen shot shows the oprofile command used to dump data collected during the sample followed by a simple execution of the opreport command.


opdump


OK, here is where it gets good. In the vmstat(8) output above we see that system mode cycles were about 20% of the total. This simple report shows us a quick sanity check. The aggregate of the core kernel routines (vmlinux) account for 65% of that 20%–13% of all processor cycles. Jumping over the cost of running OProfile (23%) to the Qlogics Host Bus Adaptor driver we see that even though there are 13,142 IOPS, the device driver is handling that with only about 6% of system mode cycles—about 1.2% of all processor cycles.

The Dire Cost of Deploying Oracle on Cluster Filesystems
It is true that Cluster Filesystems inject code in the I/O code path. To listen to the FUD-patrol, you’d envision a significant processor overhead. I would if I heard the FUD and wasn’t actually measuring anything. As an example, the previous screen shot shows that by adding the PolyServe device driver and PolyServe Cluster Filesystem modules (psd, psfs) together there is 3.1% of all kernel mode cycles (.6% of all cycles) expended in PolyServe code—even at 13,142 physical disk transfers per second. Someone please remind me the importance of using raw disk again? I’ve been doing performance work on direct I/O filesystems that support asynchronous I/O since 6.0.27 and I still don’t get it. Anyway, there is more that OProfile can do.

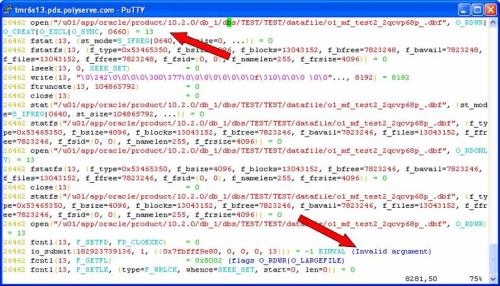
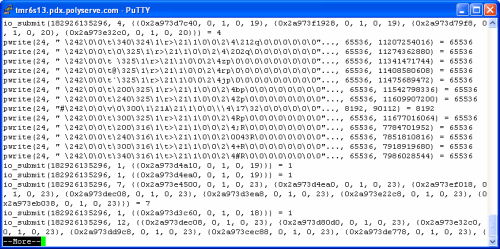
The following screen shot shows an example of getting symbol-level costing. Note, I purposefully omitted the symbol information for the Qlogic HBA driver and OProfile itself to cut down on noise. So, here is a trivial pursuit question: what percentage of all processor cycles does RHEL 4 on a DL-585 expend in processor scheduling code when the system is sustaining some 50,000 context switches per second? The routine to look for is schedule() and the following example of OProfile shows the answer to the trivial pursuit question is 8.7% of all kernel mode cycles (1.7% of all cycles).

sym1

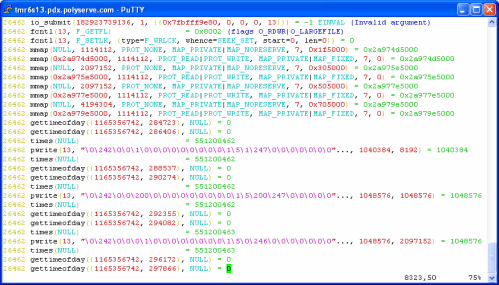
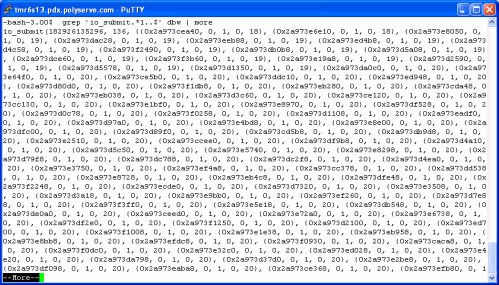
The following example shows me where PolyServe modules rank in the hierarchy of non-core kernel (vmlinux) modules. Looks like only about 1/3rd the cost of the HBA driver and SCSI support module combined.

sym2

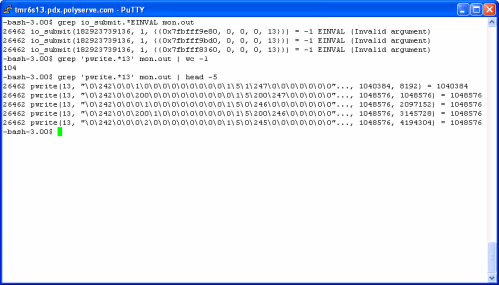
If I was concerned about the cost of PolyServe in the stack, I would use the information in the following screen shot to help determine what the problem is. This is an example of per-symbol accounting. To focus on the PolyServe Cluster Filesystem, I grep the module name which is psfs. I see that the component routines of the filesystem such as the lock caching layer (lcl), cluster wide inode locking (cwil) and journalling are evenly distributed in weight—no “sore thumbs” sticking up as they say. Finally, I do the same analysis for our driver, PSD, and there too see no routine accounting for any majority of the total.

sym3

Summary
There are a couple of messages in this blog post. First, since tools such as OProfile exist, there is no reason not to actually measure where the kernel mode cycles go. Moreover, this sort of analysis can help professionals avoid chasing red herrings such as the fairy tales of measurable performance impact when using Oracle on quality direct I/O cluster filesystems. As I like to say, “Measure before you mangle.” To that end, if you do find yourself in a situation where you are losing a significant amount of your processor cycles in kernel mode, OProfile is the tool for you.

3PAR and PolyServe Partner for Utility Computing Offerings

Oracle, SQL Server and Scalable File Serving on 3PAR and PolyServe
This is just a quick bit about the joining of forces in storage management. In this article about 3PAR and PolyServe, I see a very important quote:

“Homescape relies on 3PAR and PolyServe for mission-critical database and file serving to support the complete set of robust local home listings we provide to consumers,” stated Nancy Pejril, Director of Technical Operations and Quality Assurance for Homescape at Classified Ventures — whose divisions include cars.com, apartments.com, Homescape and HomeGain.


What Does This Have To Do With ASM?
Since this is an Oracle blog, I’ll point out that the customer quoted is Classified Ventures who are a very stable, happy Oracle RAC customer and have been since the early days of Oracle9i RAC. And to think, they don’t get to deal with bugs like this or or this. They have been running RAC in the PolyServe Database Utility for Oracle RAC for years.

Thin Provisioning for Oracle?
I have to admit that I have not had a great deal of time with 3PAR’s Thin Provisioning. The paper referenced in that URL goes on an on about allocating space to ASM only on demand. My knowledge of ASM leads me to believe that would either not work at all or not well, but like I said, I haven’t given Thin Provisioning a whirl. Oracle files are not sparse, so I must be missing something. No matter though, the combination of 3PAR and PolyServe supports an Oracle deployment in the more reasonable, traditional filesystem approach. Pretty much all other data in the world is stored in filesystems and since Oracle has done OK with them for 30 years, maybe Oracle shops aren’t clamoring for an unnecessary change. Or better yet, maybe there is so much non-Oracle data out there alongside Oracle that a one-off style of disk management isn’t going to fit in all that well.

Low-Level Disk Allocation Support!
One thing about 3PAR that I see mentioned in that paper—and I’ve had confirmation from the field on this—is that 3PAR arrays support the ability to choose the actual regions of the disks to comprise a LUN. Now that I like! You’ll often hear us cronies from the OakTable pushing the concept of allocating storage for IOPS as opposed to capacity. Further, we talk of preferring the outer, say, 50-60% of a platter for primary Oracle usage and the remainder for non-transactional operations like disk-to-disk backup and so on. That paper reads:

For example, administrators can use the powerful, yet simple-to-use provisioning rules to specify whether the inner or outer regions of a disk drive should be used for data placement. Once selected, the rules are applied automatically during volume provisioning. IT organizations with performance sensitive databases can utilize this unique flexibility of the 3PAR InServ platform to place database files and log files on higher-performance outer regions while the archive logs and backup files can be placed on lower-performance inner regions

MySQL Databases in Excess of 4GB!

Enterprise Open Source Magazine reported that MySQL is now capable of managing a 4GB database! But that is not all, it seems the deployment mentioned in the article can even scale to 14GB! Regarding MySQL, the article states:

“We provide customers with fault-tolerant availability of 99.999 percent”, says Mike Wiedemann, MySQL AB’s country sales director for Central Europe. He also explains the details of the Toto-Lotto’s MySQL Cluster implementation: The software is run within a traditional architecture on the presentation, application and persistence level on two SQL and four NDB nodes in a Linux environment. Although the database currently holds 4 GB, the system is designed to comfortably scale to 14 GB and 1.600 queries per second.

And:

According to Lotto Niedersachsen, their main reasons for the future expansion of its MySQL use are: High speed, Easy scalability, Availability of high-quality professional support, Excellent price/performance ratio.

It is not clear whether this MySQL deployment is back-ended with InnoDB or not. If not, I wonder if that had anything to do with the fact that Oracle owns InnoDB now? No matter the reason, I think either the bar is set pretty low for MySQL, or the article reported the database size one or more orders of magnitude incorrectly!

A Tip About the ORION I/O Generator Tool

I was recently having a chat with a friend about the Oracle ORION test tool. I like Orion and think it is a helpful tool. However, there is one aspect of Orion I thought I’d blog about because I find a lot of folks don’t know this bit about Orion’s I/O profile.

Generating an OLTP I/O Profile With Orion
If you use Orion to simulate OLTP, be aware that the profile is not exactly like Oracle. Orion uses libaio asynchronous I/O routines (e.g., io_submit(2)/io_getevents(2)) for reads as well as writes.This differs from a real Oracle database workload, because the main reads performed by the server in an OLTP workload are db file sequential reads which are random single-block synchronous reads. For that matter, foreground direct path reads are mostly (if not entirely) blocking single block requests. The net effect of this difference is that Orion can generate a tremendous amount of I/O traffic without the process scheduling overhead Oracle causes with blocking reads.

There is a paper that includes information about ORION in the whitepapers section of my blog. Also, ORION is downloadable from Oracle’s OTN website.

Trivial Pursuit
Why is it that random single-block synchronous reads are called db file sequential read in Oracle? Because the calls are made sequentially, one after the other. It is not because the target disk blocks are sequential in the file being accessed.

No More Oracle Ports to Solaris/AIX/HP-UX. After Oracle11g?


BLOG UPDATE: After writing this piece back in December 2006, I found a page on searchdatacenter.com about HP’s promotion to get Sun SPARC customers over to Proliant server. Yes, that would be a no-brainer move, but not painless…enter Transitive. Along the same lines of what I stated in this blog entry, that news about HP included the following bit about Transitive:

In conjunction with the certification announcement, HP publicized a new relationship with Transitive Corp., which ports software across multiple processor and operating system pairs.

Transitive’s QuickTransit for Solaris/SPARC-to-Linux/x86-64 solution enables applications that have been compiled for the Solaris on SPARC to run on certified 64-bit HP ProLiant platforms running Linux without requiring any source code or binary changes, HP reported.

Oracle no longer has to port the database to such a wide array of platforms for the sake of garnering market share. They won that battle—rightly so. Who else had such an optimized RDBMS on so many platforms? Nobody, period. But most of those platforms are dead. So, imagine the reduced cost for Oracle to produce their database—someday in the future—on only one platform. Guess what platform that would be? Linux of course. “Oh boy, he’s fallen off the deep end”, you say. No, really, read on.

Porting Is Expensive—Beyond Labor
It costs Oracle to maintain multiple ports not withstanding that fact that the varying productlines supply engineering resources. Even Sequent had 27 engineers stationed on site at Redwood Shores. All that additional free manpower aside, the very existence of so many ports is a cost that is hard to explain to shareholders and analysts when it is an expense that Microsoft clearly doesn’t have to bear. Remember, the parties that matter the most at this point of the game are the analysts and shareholders.

I’m a huge fan of “real systems”. You know, the sorts of systems where life-and-death applications are running and the people managing them can sleep at night knowing their system isn’t going to kill people because it crashes all the time. I’m glad there are still systems like System z9 mainframes, System p running AIX, Itanium2 Superdomes running HP-UX and so on. These are systems that are tried and true. And, no, they are not open source. These systems belong—period. What does this have to do with Oracle?

One Port
OK, if you are still with me, picture this. Oracle stops porting to all instruction sets except x86_64—and only Linux. That reduces the cost of producing the database product (by a very small amount I know) and makes analysts happy. It looks more like what Microsoft does. It looks more like what the open source databases do. It looks young and fresh. By the way, I know you can run MySQL on SPARC. Like I say, “sometimes man bites dog.” I digress.

How Would Oracle Pull This Off?
The same way Apple pulled the PowerPC to Intel switch—Rosetta. Rosetta works, we all know that. What not a lot of people know is that Rosetta is Transitive. I just found that out myself. Transitive works. IBM is already using Transitive to woo customers to run their x86 Linux applications on PowerPC Linux. It all starts to make your head swim.

Introducing the High-End Oracle Server of the Future
OK, so there is only one Oracle distribution—x86_64 Linux. That’s it. Well, the way it could end up is that if you want to run the single Oracle port in maximum performance mode, you run x86_64 hardware. How bad is that? Remember, this is the era of commodity processors delivering more than 50,000 TpmC. And Moore’s Law is on your side. Although the current application of Transitive is mostly to bring non-Intel executables to Intel platforms, it certainly can go both ways. How would the likes of IBM, HP and Sun deliver value in their high end systems? It could wind up that the competitive edge between these high end vendors boils down to nothing more than which platform performs something like Transitive better. If you want the really cool things that high end System p offers? Buy it. Load Oracle over Transitive and away you go. Like the power savings of Sun CoolThreads? Buy it. Want to run Oracle on it? You know the drill—Transitive.

I’ll leave you with a final thought. This sort of thing would make more business sense than technical sense. Which do you think has more weight?


Mark Rittman Changed His Header Photo. Hey, Where is All That OakTable Grey Hair?

Now that’s cool. I see the header photo over at the Mark Rittman Oracle Blog is a photo of that cool impromptu “Oaktable” they put up for us at UKOUG. That was a great conference.

Oh, by the way, Mark Rittman has a really good blog.

Testing RAC Failover: Be Evil, Make New Friends.

In Alejandro Vargas’ blog entry about RAC & ASM, Crash and Recovery Test Scenarios, some tests were described that would cause RAC failovers. Unfortunately, none of the faults described were the of the sort that put clusterware to the test. The easiest types of failures for clusterware to handle are complete, clean outages. Simply powering of a server, for instance, is no challenge for any clusterware to deal with. The other nodes in the cluster will be well aware that the node is dead. The difficult scenarios for clusterware to respond to are states of flux and compromised participation in the cluster. That is, a server that is alive but not participating. The topic of Alejandro’s blog entry was not a definition of a production readiness testing plan by any means, but it was a good segway into the comment I entered:

These are good tests, yes, but they do not truly replicate difficult scenarios for clusterware to resolve. It is always important to perform manual fault-injection testing such as physically severing storage and network connectivity paths and doing so with simultaneous failures and cascading failures alike. Also, another good test to [run] is a forced processor starvation situation by forking processes in a loop until there are no [process] slots [remaining]. These […] situations are a challenge to any clusterware offering.

Clusterware is Serious Business
As I pointed out in my previous blog entry about Oracle Clusterware, processor saturation is a bad thing for Oracle Clusterware—particularly where fencing is concerned. Alejandro had this to say:

These scenarios were defined to train a group of DBA’s to perform recovery, rather than to test the clusterware itself. When we introduced RAC & ASM we did run stress & resilience tests. The starvation test you suggest is a good one, I have seen that happening at customer sites on production environments. Thanks for your comments.

Be Mean!
If you are involved with a pre-production testing effort involving clustered Oracle, remember, be evil! Don’t force failover by doing operational things like shutting down a server or killing Oracle clusterware processes. You are just doing a functional test when you do that. Instead, create significant server load with synthetic tests such as wild loops of dd(1) to /dev/null using absurdly large values assigned to the ibs argument or shell scripts that fork children but don’t wait for them. Run C programs that wildly malloc(2) memory, or maybe a little stack recursion is your flavor—force the system into swapping, etc. Generate these loads on the server you are about to isolate from the network for instance. See what the state of the cluster is afterwards. Of course, you can purposefully execute poorly tuned Parallel Query workloads to swamp a system as well. Be creative.

Something To Think About
For once, it will pay off to be evil. Just make sure whatever you accept as your synthetic load generator is consistent and reproducible because once you start this testing, you’ll be doing it again and again—if you find bugs. You’ll be spending a lot of time on the phone making new friends.

Oracle Performance on Sun’s “Rock” Processors and Oracle Scalability

The late breaking news of the day is that by December 31st, Sun engineers will have taped out the next generation mega-multi-core processor called “Rock”. Some is good, so more must be better. This one offers 16 cores. News has been out about Rock for several years. Back in 2004 the project had the code name “Project 30x” because it aimed to out-perform the US-III of the day by a factor of 30. On the humor side, this zdnet.com article about the Sun “Rock” chip throws in a twist. It seems if the processor is not taped out by the end of the year, Sun engineers have to wear ties. I’d hate to see that happen.

What Does This Have To Do With Oracle?
These processors are going to be really, really fast. The first generation will be based on 65nm real estate, but the already planned follow-on 45nm offering will up the ante even more. I recently blogged about Sun CoolThreads “Niagra” performance with Oracle. Fact is that shops currently running Oracle on SPARC hardware of the Ultra Enterprise class can easily migrate over to these new systems—particularly for OLTP. Those are 8 core (90nm) packages. With Rock, I think we can expect performance commensurate with the packaging. That means a single multi-core system based on this technology is, quite honestly, nearly too big.

Datacenters today are scrambling to get their processor utilization up and their power consumption down. And, oh, is Oracle going to charge .25 of a CPU license per core? The bottom line for Rock is that there is a tremendous number of Sun Ultra Enterprise gear out there that will need replacing soon. Maybe some of the replacement-business will help Sun continue their trend as the only vendor seeing server revenue increases. All the other vendors seem to be finding that new purchases are being held back by the continuing effort to chop these already “small” servers into smaller servers with virtualization.

No, Really, What Does This Have To Do With Oracle?
Folks, this is the era of multi-core processors (e.g., the Xeon 53XX Clovertown) that achieve TPC-C results of 50,000+ per core. Remember, the highest result ever attained by the venerable Starfire UE 10000 was roughly 155,000—with 64 CPUs. It won’t be long until you are carving up a single core to support your Oracle database. And I pose that sub-core Oracle database deployments will be the lion’s share of the market too. But even for the “heavy” databases, it wont be long until they too only require just some of the cores that a single socket will offer.

Who Scales Better? Oracle? DB2? MySQL?
Oracle raced to the head of the pack throughout the 1990s by offering the most robust SMP scalability. So let me ask, if your application can be back-ended by Oracle executing within a virtual processor that represents only a portion of a socket, how scalable does the RDBMS kernel really need to be?

AMD Quad-Core “Barcelona” Processor For Oracle (Part I)

I haven’t seen much in the Oracle blogosphere on this topic. Let me see if I can get it going…

AMD’s move into quad-core processors has me thinking. First, I like how this arstechnica.com article about AMD’s quad-core “Barcelona” processor is a ”true” quad-core as opposed to the Xeon 5300 family which is actually 2 dual core processors mated in a multi-chip module (MCM). The article reads:

AMD touts Barcelona as a “true” quad-core processor, because it features a highly integrated design with all four cores on a single die with some shared parts. This is in contrast to Intel’s “quad-core” Kentsfield parts, which use package-level integration to get two separate dual-core dies in the same socket. For my part, I’m inclined to agree with AMD that Barcelona is real quad-core and Kentsfield isn’t, but I gave up fighting that semantic fight a long time ago. Nowadays, if it has four cores in a single package, I (grudgingly) call it “quad-core.”

I agree with the author on that point.

Just recently I worked the HP demo booth at UKOUG with Steve Shaw of Intel. I actually found myself playing a little po-tay-toe/po-tah-toe regarding the nature of just how true each of these quad-core packages were. Honestly, I think I held that stance for just a moment, because the point is moot. Let me explain. It is all about Oracle licensing.

Oracle licenses Intel cores at .5 of a CPU, rounded up to the next whole number. So a single socket, quad-core system is .5 x 4 or 2 full CPU licenses. On the other hand, single socket/dual-core is .5 x 2 or 1 CPU license. The power of these processors is no longer a challenge of how much you can get as much as it is how little you can get. If the workload can be satisfied with a single socket/dual-core, the price savings in Oracle licensing alone might motivate folks to buy such a system. Oracle is the most expensive thing you buy after all. What systems are there that offer significant performance in a single socket/dual-core? Itanium. It seems you can order the HP Integrity rx3600 with a single scoket. There I said it. Now I need to go kneel on peach pits or something to make me feel properly chastised.

There is more to it than hardware. Oracle ports have always lagged for Itanium Linux. In fact, Oracle10g was released on PowerPC Linux before Itanium.

I just think Intel missed the boat in the late 1990s on getting Merced to market in a package worth having. And who really needed another instruction set? Now I digress.

Using Oracle Disk Manager to Monitor Database I/O

Some of the topics in this post are also covered in the Julian Dyke/Steve Shaw RAC book that came out last summer. I enjoyed being one of the technical reviewers of the book. It is a good book.

Monitoring DBWR Specifically
I have received several emails from existing PolyServe customers asking me why I didn’t just use the Oracle Disk Manager (ODM) I/O monitoring package that is included in the PolyServe Database Utility for Oracle to show the multi-block DBWR writes I blogged about in this post. After all, there is very little left to the imagination when monitoring Oracle using this unique feature of our implementation of the Oracle Disk Manager library specification.

This URL will get you a copy of the I/O Monitoring feature of our Oracle Disk Manager library. It is quite a good feature.

I didn’t use ODM for the first part of that thread because I wanted to discuss using strace(1) for such purposes. Yes, I could have just used the mxodmstat(1) command that comes with that package and I would have seen that the average I/O size was not exactly db_block_size as one would expect. For instance, the following screen shot is an example of cluster wide monitoring of DBWR processes. The first invocation of the command is used to monitor DBWR only followed by another execution of the command to monitor LGWR. The average size of the async writes for DBWR are not precisely 8KB (the db_block_size for this database) as they would be if this was Oracle9i:

NOTE: You may have to right click->view the screen shot

dom1

As an aside, the system was pretty busy as the following screen shot will show. This is a non-RAC database on an HP Proliant DL-585 where database writes are peaking at roughly 140MB/s. You can also see that the service times (Ave ms) for the writes are averaging a bit high (as high as 30ms). Looks like I/O subsystem saturation.

odm2


Oh, here’s a quick peek at one nice feature of mxodmstat(1). You can dump out all the active files, clusterwide, for any number of database/instances and nodes using the –lf options:

odm3

I hope you take peek at the User Guide for this feature. It has a lot of examples of what the tool can do. You might find it interesting—perhaps something you should push your vendor to implement?


Analyzing Asynchronous I/O Support with Oracle10g

This is not a post about why someone would want to deploy Oracle with a mix of files with varying support for asynchronous I/O. It is just a peek at how Oracle10g handles it. This blog post is a continuation of yesterday’s topic about analyzing DBWR I/O activity with strace(1).

I’ve said many times before that one of the things Oracle does not get sufficient credit for is the fact that the database adapts so well so such a tremendous variety of platforms. Moreover, each platform can be complex. Historically, with Linux for instance, some file systems support asynchronous I/O and others do not. With JFS on AIX, there are mount options to consider as is the case with Veritas on all platforms. These technologies offer deployment options. That is a good thing.

What happens when the initialization parameter filesystemio_options=asynch yet there are a mix of files that do and do not support asynchronous I/O? Does Oracle just crash? Does it offline files? Does it pollute the alert log with messages every time it tries an asynchronous I/O to a file that doesn’t support it? The answer is that it does not of that. It simply deals with it. It doesn’t throw the baby out with the bath water either. Much older versions of Oracle would probably have just marked the whole instance to the least common demoninator (synchronous).

Not Just A Linux Topic
I think the information in this blog post should be considered useful on all platforms. Sure, you can’t use strace(1) on a system that only offers truss(1), but you can do the same general analysis with either. The system calls will be different too. Whereas Oracle has to use the Linux-only libaio routines called io_submit(2)/io_getevents(2), all other ports[1] use POSIX asynchronous I/O (e.g., lio_listio,aio_write,etc) or other proprietary asynchronous I/O library routines.

Oracle Takes Charge
As I was saying, if you have some mix of technology where some files in the database do not support asynchronous I/O, yet you’ve configured the instance to use it, Oracle simply deals with the issue. There are no warnings. It is important to understand this topic in case you run into it though.

Mixing Synchronous with Asynchronous I/O
In the following screen shot I was viewing strace(1) output of a shadow process doing a tablespace creation. The instance was configured to use asynchronous I/O, yet the CREATE TABLESPACE command I issued was to create a file in a filesystem that does not support asynchronous I/O[2]. Performing this testing on a platform where I can mix libaio asynchronous I/O and libc synchronous I/O with the same instance makes it easy to depict what Oracle is doing. At the first arrow in the screen shot, the OMF datafile is created with open(2) using the O_CREAT flag. The file descriptor returned is 13. The second arrow points to the first asynchronous I/O issued against the datafile. The io_submit(2) call failed with EINVAL indicating to Oracle that the operation is invalid for this file descriptor.

NOTE: Firefox users report that you need to right click->view the image to see these screen shots

d2_1

Now, Oracle could have raised an error and failed the CREATE TABLESPACE statement. It did not. Instead, the shadow process simply proceeded to create the datafile with synchronous I/O. The following screen shot shows the same io_submit(2) call failing at the first arrow, but nothing more than the invocation of some shared libraries (the mmap() calls) occurred between that failure and the first synchronous write using pwrite(2)—on the same file descriptor. The file didn’t need to be reopened or any such thing. Oracle simply fires off a synchronous write.

dbw2_2

What Does This Have To Do With DBWR?
Once the tablespace was created, I set out to create tables in it with CTAS statements. To see what DBWR behaved like with this mix of asynchronous I/O support, I once again monitored DBWR with strace(1) sending the trace info to a file called mon.out. The following screen shot shows that the first attempts to flush SGA buffers to the file also failed with EINVAL. All was not lost however, the screen shot also shows that DBWR continued just fine using synchronous writes to this particular file. Note, DBWR does not have to perform this “discovery” on every flushing operation. Once the file is deemed unsuitable for asynchronous I/O, all subsequent I/O will be synchronous. Oracle just continues to work, without alarming the DBA.

dbw2_3

How Would a Single DBWR Process Handle This?

So the next question is what does it mean to have a single database writer charged with the task of flushing buffers from the SGA to a mix of files where not all files support asynchronous I/O? It is not good. Now, as I said, Oracle could have just reverted the entire instance to 100% synchronous I/O, but that would not be in the best interest of performance. On the other hand, if Oracle is doing what I’m about to show you, it would be nice if it made one small alert log entry—but it doesn’t. That is why I’m blogging this (actually it is also because I’m a fan of Oracle at the platform level).

In the following screen shot, I use egrep(1) to pull occurrences from the DBWR strace(1) output file where io_submit(2) and pwrite(2) are intermixed. Again, this is a single DBWR flushing buffers from the SGA to files of varying asynchronous I/O support:

dbw2_4

In this particular case, the very first io_submit(2) call flushed 4 buffers, 2 each to file descriptors 19 and 20. Before calling io_getevents(2) to process the completion of those asynchronous I/Os, DBWR proceeds to issue a series of synchronous writes to file descriptor 24 (another of the non-asynchronous I/O files in this database). By the way, notice that most of those writes to file descriptor 24 were multi-block DBWR writes. The problem with having one DBWR process intermixing synchronous with asynchronous I/O is that any buffers in the write batch bound for a synchronous I/O file will cause a delay in the instantiation of any buffer flushing to asynchronous I/O files. When DBWR walks an LRU to build a batch, it is not considering the lower-level OS support of asynchronous I/O on the file that a particular buffer will be written to. It just builds a batch based on buffer state and age. In short, synchronous I/O requests will cause a delay in the instantiation of subsequent asynchronous requests.

OK, so this is a two edged sword. Oracle handles this complexity nicely—much credit due. However, it is not entirely inconceivable that some of you out there have databases configured with a mix of asynchronous I/O support for your files. From platform to platform this can vary so much. Please be aware that this is not just a file system topic. It can also be a device driver issue. It is entirely possible to have a file system that generically supports asynchronous I/O created on a device where the device driver does not. This scenario will also result in EINVAL on asynchronous I/O calls. Here too, Oracle is likely doing the right thing—dealing with it.

What To Do?
Just use raw partitions. No, of course not. We should be glad that Oracle deals with such complexity so well. If you configure multiple database writers (not slaves) on a system that has a mix of asynchronous I/O support, you’ll likely never know the difference. But the topic is at least on your mind.

[1] Except Windows of course

[2] The cluster  file system in PolyServe’s Database Utility for Oracle uses a mount option to enable both direct I/O and OS asynchronous I/O. However, when using PolyServe’s Oracle Disk Manager (ODM) Library Oracle can perform asynchronous I/O on all mount types. Mount options for direct I/O is quite common as this is a requirement on UFS and OCFS2 as well.

A Quick Announcement About Scalable NAS

A Quick Announcement About NAS

If you, or anyone in your datacenter, is interested in Scalable NAS, this enterprisestorageforum.com article may be of interest. Additionally, if you are interested you can sign up here for a web demonstration of Scalable NAS. Note, the same sign up sheet will allow you to sign up for web demonstrations of PolyServe’s Database Utility for Oracle as well.

Note, clustered storage is really catching on and I think it should be of interest to any forward-looking DBA, Oracle IT Architect, Storage Administrator or Unstructured Data Administrator.

It is possible that NAS will be/should be a part of your Oracle deployement at some point.


Analyzing Oracle10g Database Writer I/O Activity on Linux

Using strace(1) to Study Database Writer on Linux
This is a short blog entry for folks that are interested in Oracle10g’s usage of libaio asynchronous I/O routines (e.g., io_submit(2)/io_getevents(2)). For this test, I set up Oracle10g release 10.2.0.1 on Red Hat 4 x86_64. I am using the cluster filesystem bundled with the PolyServe’s Database Utility for Oracle, but for all intents and purposes I could have used ext3.

The workload is a simple loop of INSERT INTO SELECT * FROM statements to rapidly grow some tables thereby stimulating Database Writer (DBWR) to flush modified SGA buffers to disk. Once I got the workload running, I simply executed the strace command as follows where <DBWR_PID> was replaced with the real PID of the DBWR process:

$ strace -o dbw -p <DBWR_PID>

NOTE: Using strace(1) imposes a severe penalty on the process being traced.  I do not recommend using strace(1) on a production instance unless you have other really big problems the strace(1) output would help you get under control.

The second argument to the io_submit(2) call is a long integer that represents the number of I/O requests spelled out in the current call. The return value to an io_submit(2) call is the number of iocb’s processed. One clever thing to do is combine grep(1) and awk(1) to see what degree of concurrent I/O DBWR is requesting on each call. The following screen shot shows an example of using awk(1) to select the io_submit(2) calls DBWR has made to request more than a single I/O. All told, this sould be the majority of DBWR requests.

NOTE: You may have to right click->view the image. Some readers of this blog have reported this. Sorry

strace 1

Another way to do this is to anchor on the return to the io_submit(2) call. The following screen shot shows an example of grep(1) to selecting only the io_submit(2) calls that requested more than 100 I/O transfers in a single call.

strace 2

What File Descriptors?
When io_submit(2) is called for more than one I/O request, the strace(1) output will string out details of each individual iocb. Each individual request in a call to io_submit(2) can be for a write to a different file descriptor. In the following text grep(1)ed out of the strace(1) output file, we see that Oracle requested 136 I/Os in a single call and the first 2 iocbs were requests to write on file descriptor 18.:

io_submit(182926135296, 136, {{0x2a973cea40, 0, 1, 0, 18}, {0x2a973e6e10, 0, 1, 0, 18}

What About ASM?
You can run ASM with libaio. If you do, you can do this sort of monitoring, but you wont really be able to figure out what DBWR is writing to because the file descriptors will just point to raw disk. ASM is raw disk.


Oracle OS Watcher (OSW) Scripts

Dave Moore discusses the relatively new set of OS performance data collections scripts on his webpage here.  Dave writes:

OS Watcher is a utility provided on MetaLink (Note 301137.1) primarily for support issues in a RAC environment. I must admit I was captivated by the name and wondered if I could use this tool instead of expensive 3rd party products for monitoring key operating system metrics. The verdict is “no” and I was less than impressed.

OS Watcher is a series of shell scripts that run on AIX, Solaris, HP-UX and Linux. Simple commands such as ps, top, vmstat, netstat and others are executed at regular intervals and their output is appended to a file in a directory specific to that command.

I have not personally taken the time to play with these scripts (I have my own), but I can read the tea leaves. Oracle support will most likely start asking for this data for any problem you might be having (regardless of whether you have a performance related problem). It might be smart to start collecting this data so you don’t hear something like, “Please reproduce the problem after installing OSW.” Just a thought.

I’ll see if I can arrange a test of how heavy the collection of this data is and blog on what I find. I read through the scripts and it looks like some pretty heavy collection. I never liked performance monitoring tools that carry a heavy “tare weight”. Did any of you use CA Unicenter in the old days?

If you have a Metalink account the toolkit is available here.


DISCLAIMER

I work for Amazon Web Services. The opinions I share in this blog are my own. I'm *not* communicating as a spokesperson for Amazon. In other words, I work at Amazon, but this is my own opinion.

Enter your email address to follow this blog and receive notifications of new posts by email.

Join 741 other subscribers
Oracle ACE Program Status

Click It

website metrics

Fond Memories

Copyright

All content is © Kevin Closson and "Kevin Closson's Blog: Platforms, Databases, and Storage", 2006-2015. Unauthorized use and/or duplication of this material without express and written permission from this blog’s author and/or owner is strictly prohibited. Excerpts and links may be used, provided that full and clear credit is given to Kevin Closson and Kevin Closson's Blog: Platforms, Databases, and Storage with appropriate and specific direction to the original content.