Archive for the 'Oracle Clusters' Category

Oracle Direct I/O Brought to You By Deranged Monkeys

If you have an Linux system, check the “bugs” section of the man page for the open(2) system call and you’ll see the following quote from Linus Torvalds:

The thing that has always disturbed me about O_DIRECT is that the whole interface is just stupid, and was probably designed by a deranged monkey on some serious mind-controlling substances -Linus

I’m not joking, read that man page and you’ll see. Now, while I much prefer a mount option approach to direct I/O, I don’t think the O_DIRECT style of direct I/O was the brain child of a deranged monkey. I wonder if Linus is insinuating that the interface would be better if it was written by a sane monkey—or perhaps even a deranged monkey that is not on some serious mind-controlling substances?

There is nothing strange about O_DIRECT and most of the Unix derivations I am aware of are happy to offer it (Solaris being the notable exception offering directio(3C) instead). I’d love to know more about the context of that Linus quote. I’ve been around O_DIRECT since the very early 1990s. Sequent supported O_DIRECT opens on DYNIX/ptx file system files way back in 1991.

The Linux kernel development community still languishes over the fact that software like Oracle does not like to kernel-dive to access buffered data, preferring to do its own buffering instead.

A Mount-Option Approach
Why? Well, if you have programs that perform properly aligned I/O calls (e.g., cat(1), dd(1), cp(1), etc) but you don’t want them “polluting “ your system page cache, then you either need a mount-option approach to do Direct I/O or the tools need to be re-coded to open O_DIRECT. Back in 2001 I had the opportunity to make that choice for PolyServe and I haven’t regretted it once. Let me explain.

Let’s say, for instance, you generate and compress a few gigabytes of archived redo logs per day—or roughly ~40KB per second. It doesn’t sound like much, I know. But let’s look at page cache costs. When ARCH spools an offline redo log to the archive log destination the OS page cache will be used to buffer the I/O. When your compression tool (e.g. compress(P), gzip(1)) reads the file, page cache will once again be used. As the output of compress needs to be written page cache is used. Finally, when the archived redo is copied off the system (e.g., to tape), page cache will again be used. All this caching for data that is not used again—save for emergencies. But really, caching sequentially read archived files and compress output? Makes little sense.

The only way to not cache this sort of data is O_DIRECT, but I/Os issued against an O_DIRECT opened file must be multiples of the underlying disk block size (generally 512 bytes). The buffer in the calling process used for the I/O must also be a aligned on an address that is a multiple of the OS page size. It turns out that most OS tools perform proper alignment of their I/O buffers. So where is the rub? The I/O sizes! Even if you coded your compress tool to use O_DIRECT (deranged monkey syndrome), the odds that the output file will be a multiple of 512 bytes is nil. Let’s look at an example.

Direct I/O for Better Memory Utilization
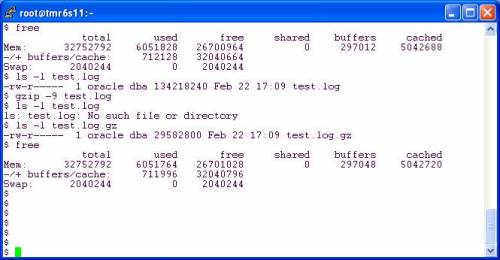
In the following session I performed 6 steps to see the effect of direct I/O:

  1. Use df to determine space and exact filesystem of my current working directory (CWD)
  2. Check the Mount options. My CWD is a PolyServe PSFS mounted with the DBOptimized mount option which “renders” direct I/O akin to the Solaris –forcedirectio mount option.
  3. List my redo logs. Note, they are OMF files so the names are a bit strange.
  4. Check free memory on the system
  5. Copy a redo log
  6. Check free memory again to see how much memory was used by the OS page cache

fig1.jpg

OK, hold it, in step 5 I copied a 128MB file and yet the free memory available only changed by 176KB (from step 4 to step 6). My copy of an online log closely resembles what ARCH does—it simply copies the inactive online redo log to the archive log destination. I like the ability to not consume 256MB of physical memory to copy a file that is no longer really part of the database! The cp(1) command performs I/O with requests that are 512byte multiples, so the PolyServe CFS mounted in the DBOptimized mode simply “renders” the I/O through the direct I/O code path. No, cp(1) does not open with O_DIRECT, yet I relieved the pressure on free memory by copying with Direct I/O via the mount option. That’s good.

File Compression with Direct I/O Mounted Filesystem
But what about compressing files in a direct I/O filesystem? Let’s take a look. In the next session I did the following:

  1. Check free memory on the system
  2. Used ls(1) to see my copy of the redo log file.
  3. Used gzip(1) with maximum compression on the copy of the redo log file
  4. Used ls(1) to see the file size of the compressed file.
  5. Check free memory on the system to see what OS page cache was used

fig2.jpg

OK, this is good. I take a 128MB redo log file and compress it down to 29,582,800 bytes—which is, of course, 57,778 512 byte chunks plus one 464 byte chunk. According to the differences in free memory from step 1 and step 5, only 64KB of system memory was “wasted” in the act of compressing that file. Why do I say wasted? Because cache is best used for sharing data such as in the SGA, however, here I was able to read in 128MB and write out 28.2MB and only used 64KB of page cache in the process. Memory costs money and efficiency matters. This is the reason I prefer a mount option approach to direct I/O.

Back to the example. How did I write an amount that included a stray 464 bytes with direct I/O? That is not a multiple of the underlying disk driver requirement which is 512 bytes.
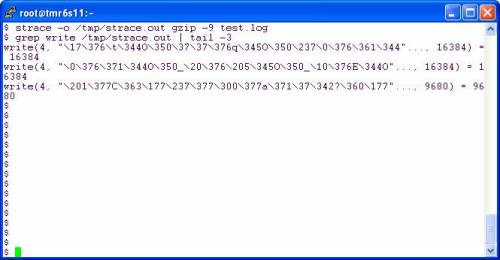
Under The Covers
On Linux, gzip(1) uses 32KB reads and 16KB writes. The output file created by gzip(1) is 29,839,295 bytes which is 1,805 writes at 16KB and one last odd-ball write of 9,680 bytes—something that would be impossible to do with direct I/O were it not for the direct I/O mount option. Let’s look at strace. The last write was 9,680 bytes:

fig3.jpg

Direct I/O Without Compile-Time O_DIRECT
I can’t speak about other direct I/O mount implementations, but I can explain how PolyServe does this. All I/O bound for files in a DBOptimized mounted PSFS filesystem are quickly examined to see if the I/O meets the underlying device driver DMA requirements. In the kernel we use simple arithmetic to determine if the I/O size is a multiple of the underlying disk block size (satisfies DMA requirement) and whether the I/O buffer is aligned on a page boundry. If both conditions are true, the I/O is DMAed directly from the process address space to the disk. If not, we simply grab an OS page cache buffer, perform the I/O and then immediately invalidate that page so no other process can read dirty data (PolyServe is sort of big on cache coherency if you get my drift).

Best of Both Worlds
In the end, Linus might be right about O_DIRECT, but sitting here at PolyServe makes me say, “Who cares.” We supported direct I/O on Linux before Linux supported O_DIRECT (it was just a patch at that time). In fact, we did a 10-node Oracle9i RAC, 10 TB, 10,000 user OLTP Proof of Concept way back in 2002—before Linux O_DIRECT was mainstream. Here is a link to the paper if you are interested in that proof point.


Comparing 10.2.0.1 and 10.2.0.3 Linux RAC Fencing. Also, Fencing Failures (Split Brain).

BLOG UPDATE 2011.08.11 : For years my criticism of Oracle Clusterware fencing methodology brought ire from many who were convinced I was merely a renegade. The ranks of “the many” in this case were generally well-intended but overly convinced that Oracle was the only proven clustering technology in existence.  It took many years for Oracle to do so, but they did finally offer support for IPMI fencing integration in the 11.2 release of Oracle Database. It also took me a long time to get around to updating this post.  Whether by graces of capitulation or a reinvention of the wheel, you too can now, finally, enjoy a proper fencing infrastructure. For more information please see: http://download.oracle.com/docs/cd/E11882_01/rac.112/e16794/admin.htm#CHDGIAAD

I’ve covered the clusters concept of fencing quite a bit on this blog (e.g., RAC Expert or Clusters Expert and Now is the Time to Open Source, etc), and in papers such as this paper about clusterware, and in an appendix in the Julian Dyke/Steve Shaw book about RAC on Linux. If I’ve said it once, I’ve said it 1000 times; if you are not a clusters expert you cannot be a RAC expert. Oddly though, Oracle seems to be sending a message that clusterware is commoditized—and it really isn’t. On the other hand, Oracle was brilliant for heading down the road of providing their own clusterware. Until all the kinks are worked out, it is good to know as much as you can about what is under the covers.

Linux RAC “Fencing”
As I’ve pointed out in the above referenced pieces, Oracle “fencing” is not implemented by healthy servers taking action against rogue servers (e.g., STONITH), but instead the server that needs to be “fenced” is sent a message. With that message, the sick server will then reboot itself. Of course, a sick server might not be able to reboot itself. I call this form of fencing ATONTRI (Ask The Other Node To Reboot Itself).This blog entry is not intended to bash Oracle clusterware “fencing”—it is what it is, works well and for those who choose there is the option of running integrated Legacy clusterware or validated third party clusterware to fill in the gaps. Instead, I want to blog about a couple of interesting observations and then cover some changes that were implemented to the Oracle init.cssd script under 10.2.0.3 that you need to be aware of.

Logging When Oracle “Fences” a Server
As I mentioned in this blog entry about the 10.2.0.3 CRS patchset, I found 10.2.0.1 CRS—or is that “clusterware”—to be sufficiently stable to just skip over 10.2.0.2. So what I’m about to point out might be old news to you folks. The logging text produced by Oracle clusterware changed between 10.2.0.1 and 10.2.0.3. But, since CRS has a fundamental flaw in the way it logs this text, you’d likely never know it.

Lot’s of Looking Going On
As an aside, one of the cool things about bloggingis that I get to track the search terms folks use to get here. Since the launch of my blog, I’ve had over 11000 visits from readers looking for information about the most common error message returned if you have a botched CRS install on Linux—that text being:

PROT-1: Failed to initialize ocrconfig

No News Must Be Good News
I haven’t yet blogged about the /var/log/messages entry you are supposed to see when Oracle fences a server, but if I had, I don’t think it would be a very common google search string anyway? No the reason isn’t that Oracle so seldomly needs to fence a server. The reason is that the text generally (nearly never actually) doesn’t make it into the system log. Let’s dig into this topic.

The portion of the init.cssd script that acts as the “fencing” agent in 10.2.0.1 is coded to produce the following entry in the /var/log/messages file via the Linux logger(1) command (line numbers precede code):

194 LOGGER=”/usr/bin/logger”
[snip]
1039 *)
1040 $LOGERR “Oracle CSSD failure. Rebooting for cluster integrity.”
1041
1042 # We want to reboot here as fast as possible. It is imperative
1043 # that we do not flush any IO to the shared disks. Choosing not
1044 # to flush local disks or kill off processes gracefully shuts
1045 # us down quickly.
[snip]
1081 $EVAL $REBOOT_CMD

Let’s think about this for a moment. If Oracle needs to “fence” a server, the server that is being fenced should produce the followingtext in /var/log/messages:

Oracle CSSD failure.Rebooting for cluster integrity.

Where’s Waldo?
Why is it when I google for “Oracle CSSD failure.Rebooting for cluster integrity” I get 3, count them, 3 articles returned? Maybe the logger(1) command simply doesn’t work? Let’s give that a quick test:

[root@tmr6s14 log]# logger “I seem to be able to get messages to the log”
[root@tmr6s14 log]# tail -1 /var/log/messages
Jan 9 15:16:33 tmr6s14 root: I seem to be able to get messages to the log
[root@tmr6s14 log]# uname -a
Linux tmr6s14 2.6.9-34.ELsmp #1 SMP Fri Feb 24 16:56:28 EST 2006 x86_64 x86_64 x86_64 GNU/Linux

Interesting. Why don’t we see the string Oracle CSSD failure when Oracle fences then? It’s because the logger(1) command merely sends a message to syslogd(8) via a socket—and then it is off to the races. Again, back to the 10.2.0.1 init.cssd script:

22 # FAST_REBOOT – take out the machine now. We are concerned about
23 # data integrity since the other node has evicted us.
[…] lines deleted
177 case $PLATFORM in
178 Linux) LD_LIBRARY_PATH=$ORA_CRS_HOME/lib
179 export LD_LIBRARY_PATH
180 FAST_REBOOT=”/sbin/reboot -n -f”

So at line 1040, the script sends a message to syslogd(8) and then immediately forces a reboot at line 1081—with the –n option to the reboot(8) command forcing a shutdown without sync(1). So there you have it, the text is drifting between the bash(1) context executing the init.cssd script and the syslogd(8) process that would do a buffered write anyway. I think the planets must really be in line for this text to ever get to the /var/log/messages file—and I think the google search for that particular string goes a long way towards backing up that notion. When I really want to see this string pop up in /var/log/messages, I fiddle with putting sync(1) comands and sleep before the line 1081. That is when I am, for instance, pulling physical connections from the Fibre Channel SAN paths and studying what Oracle behaves like by default.

By the way, the comments at lines 22-23 are the definition of ATONTRI.

Paranoia?
I’ve never understood that paranoia at lines 1042-1043 which state:

We want to reboot here as fast as possible. It is imperative that we do not flush any IO to the shared disks.

It may sound a bit nit-picky, but folks this is RAC and there are no buffered writes to shared disk! No matter really, even if there was a sync(1) command at line 1080 in the 10.2.0.1 init.cssd script, the likelihood of getting text to /var/log/messages is still going to be a race as I’ve pointed out.

Differences in 10.2.0.3
Google searches for fencing articles anchored with the Oracle CSSD failure string are about to get even more scarce. In 10.2.0.3, the text that the script attempts to send to the /var/log/messages file changed—the string no longer contains CSSD, but CRS instead. The following is a snippet from the init.cssd script shipped with 10.2.0.3:

452 *)
453 $LOGERR “Oracle CRS failure. Rebooting for cluster integrity.”

A Workaround for a Red Hat 3 Problem in 10.2.0.3 CRS
OK, this is interesting. In the 10.2.0.3 init.cssd script, there is a workaround for some RHEL 3 race condition. I would be more specific about this, but I really don’t care about any problems init.cssd has in its attempt to perform fencing since for me the whole issue is moot. PolyServe is running underneath it and PolyServe is not going to fail a fencing operation. Nonetheless, if you are not on RHEL 3, and you deploy bare-bones Oracle-only RAC (e.g., no third party clusterware for fencing), you might take interest in this workaround since it could cause a failed fencing. That’s split-brain to you and I.

Just before the actual execution of the reboot(8) command, every Linux system running 10.2.0.3 will now suffer the overhead of the code starting at line 489 shown in the snippet below. The builtin test of the variable $PLATFORM is pretty much free, but if for any reason you are on a RHEL 4, Novell SuSE SLES9 or even Oracle Enterprise Linux (who knows how they attribute versions to that) the code at line 491 is unnecessary and could put a full stop to the execution of this script if the server is in deep trouble—and remember fencings are suppose to handle deeply troubled servers.

Fiddle First, Fence Later
Yes, the test at line 491 is a shell builtin, no argument, but as line 226 shows, the shell command at line 491 is checking for the existence of the file /var/tmp/.orarblock. I haven’t looked, but bash(1) is most likely calling open(1) with O_CREAT and O_EXCL and returning true on test –e if the open(1) call gets EEXIST returned and false if not. In the end, however, if checking for the existence for a file in /var/tmp is proving difficult at the time init.cssd is trying to “fence” a server, this code is pretty dangerous since it can cause a failed fencing on a Linux RAC deployment. Further, at line 494 the script will need to open a file and write to it. All this on a server that is presumed sick and needs to get out of the cluster. Then again, who is to say that the bash process executing the init.cssd script is not totally swapped out permanently due to extreme low memory thrashing? Remember, servers being told to fence themselves (ATONTRI) are not healthy. Anyway, here is the relevant snippet of 10.2.0.3 init.cssd:

226 REBOOTLOCKFILE=/var/tmp/.orarblock
[snip]
484 # Workaround to Redhat 3 issue with multiple invocations of reboot.
485 # Here if oclsomon and ocssd are attempting a reboot at the same time
486 # then the kernel could lock up. Here we have a crude lock which
487 # doesn’t eliminate but drastically reduces the likelihood of getting
488 # two reboots at once.
489 if [ “$PLATFORM” = “Linux” ]; then
490 CEDETO=
491 if [ -e “$REBOOTLOCKFILE” ]; then
492 CEDETO=`$CAT $REBOOTLOCKFILE`
493 fi
494 $ECHO $$ > $REBOOTLOCKFILE
495
496 if [ ! -z “$CEDETO” ]; then
497 REBOOT_CMD=”$SLEEP 0″
498 $LOGMSG “Oracle init script ceding reboot to sibling $CEDETO.”
499 fi
500 fi
501
502 $EVAL $REBOOT_CMD

Partition, or Real Application Clusters Will Not Work.

OK, that was a come-on title. I’ll admit it straight away. You might find this post interesting nonetheless. Some time back, Christo Kutrovsky made a blog entry on the Pythian site about buffer cache analysis for RAC. I meant to blog about the post, but never got around to it—until today.

Christo’s entry consisted of some RAC theory and a buffer cache contents SQL query. I admit I have not yet tested his script against any of my RAC databases. I intend to do so soon, but I can’t right now because they are all under test. However, I wanted to comment a bit on Christo’s take on RAC theory. But first I’d like to comment about a statement in Christo’s post. He wrote:

There’s a caveat however. You have to first put your application in RAC, then the query can tell you how well it runs.

Not that Christo is saying so, but please don’t get into the habit of using scripts against internal performance tables as a metric of how “well” things are running. Such scripts should be used as tools to approach a known performance problem—a problem measured much closer to the user of the application. There are too many DBAs out there that run scripts way down-wind of the application and if they see such metrics as high hit ratios in cache, or other such metrics they rest on their laurels. That is bad mojo. It is not entirely unlikely that even a script like Christo’s could give a very “bad reading” yet application performance is satisfactory and vise versa. OK, enough said.

Application Partitioning with RAC
The basic premise Christo was trying to get across is that RAC works best when applications accessing the instances are partitioned in such a way as to not require cross-instance data shipping. Of course that is true, but what lengths do you really have to go to in order to get your money’s worth out of RAC? That is, we all recall how horrible block pings were with OPS—or do we? See, most people that loathed the dreaded block ping in OPS thought that the poison was in the disk I/O component of a ping when in reality the poison was in the IPC (both inter and intra instance IPC). OK, what am I talking about? It was quite common for a block ping in OPS to take on the order of 200-250 milliseconds on a system where disk I/O is being serviced with respectable times like 10ms. Where did the time go? IPC.

Remembering the Ping
In OPS, when a shadow process needed a block from another instance, there was an astounding amount of IPC involved to get the block from one instance to the other. In quick and dirty terms (this is just a brief overview of the life of a block ping) it consisted of the shadow process requesting the local LCK process to communicate with the remote LCK process who in turn communicated with the DBWR process on that node. That DBWR process then flushed the required block (along with all the modified blocks covered by the same PCM lock) to disk. That DBWR then posted his local LCK who in turn posted the LCK process back where the original requesting shadow process is waiting. That LCK then posts the shadow process and the shadow process then reads the block from disk. Whew. Note, at every IPC point the act of messaging only makes the process being posted runable. It then waits in line for CPU in accordance with its mode and priority. Also, when DBWR is posted on the holding node, it is unlikely that it was idle, so the life of the block ping event also included some amount of time that was spent while DBWR finished servicing the SGA flushing it was already doing when it got posted. All told, there was quite often some 20 points where the processes involved were in runable states. Considering the time quantum for scheduling is/was 10ms, you routinely got as much as 200ms overhead on a block ping that was just scheduling delay. What a drag.

What Does This Have To Do With RAC?
Christo’s post discusses divide and conquer style RAC partitioning, and he is right. If you want RAC to perform perfectly for you, you have to make sure that RAC isn’t being used. Oh he’s gone off the deep end again you say. No, not really. What I’m saying is that if you completely partition your workload then RAC is indeed not really being used. I’m not saying Christo is suggesting you have to do that. I am saying, however, you don’t have to do that. This blog post is not just a shill for Cache Fusion, but folks, we are not talking about block pings here. Cache Fusion—even over Gigabit Ethernet—is actually quite efficient. Applications can scale fairly well with RAC without going to extreme partitioning efforts. I think the best message is that application partitioning should be looked at as a method of exploiting this exorbitantly priced stuff you bought. That is, in the same way we try to exploit the efficiencies gained by fundamental SMP cache-affinity principals, so should attempts be made to localize demand for tables and indexes (and other objects) to instances—when feasible. If it is not feasible to do any application partitioning, and RAC isn’t scaling for you, you have to get a bigger SMP. Sorry. How often do I see that? Strangely not that often. Why?

Over-configuring
I can’t count how often I see production RAC instances running throughout an entire RAC cluster at processor utilization levels well below 50%. And I’m talking about RAC deployments where no attempt has been made to partition the application. These sites often don’t need to consider such deployment tactics because the performance they are getting is meeting their requirements. I do cringe and bite my tongue however when I see 2 instances of RAC in a two node cluster—void of any application partitioning—running at, say, 40% processor utilization on each node. If no partitioning effort has been made, that means there is cache fusion (GCS/GES) in play—and lots of it. Deployments like that are turning their GbE Cache Fusion interconnect into an extension of the system bus if you will. If I was the administrator of such a setup, I’d ask Santa to scramble down the chimney and pack that entire workload into one server at roughly 80% utilization. But that’s just me. Oh, actually, packing two 40% RAC workloads back into a single server doesn’t necessarily produce 80% utilization. There is more to it than that. I’ll see if I can blog about that one too at some point.

What about High-Speed, Low-Latency Interconnects?
With OLTP, if the processors are saturated on the RAC instances you are trying to scale, high-speed/low latency interconnect will not buy you a thing. Sorry. I’ll blog about why in another post.

Final Thought
If you are one of the few out there that find yourself facing a total partitioning exercise with RAC, why not deploy a larger SMP instead? Comments?

Testing RAC Failover: Be Evil, Make New Friends.

In Alejandro Vargas’ blog entry about RAC & ASM, Crash and Recovery Test Scenarios, some tests were described that would cause RAC failovers. Unfortunately, none of the faults described were the of the sort that put clusterware to the test. The easiest types of failures for clusterware to handle are complete, clean outages. Simply powering of a server, for instance, is no challenge for any clusterware to deal with. The other nodes in the cluster will be well aware that the node is dead. The difficult scenarios for clusterware to respond to are states of flux and compromised participation in the cluster. That is, a server that is alive but not participating. The topic of Alejandro’s blog entry was not a definition of a production readiness testing plan by any means, but it was a good segway into the comment I entered:

These are good tests, yes, but they do not truly replicate difficult scenarios for clusterware to resolve. It is always important to perform manual fault-injection testing such as physically severing storage and network connectivity paths and doing so with simultaneous failures and cascading failures alike. Also, another good test to [run] is a forced processor starvation situation by forking processes in a loop until there are no [process] slots [remaining]. These […] situations are a challenge to any clusterware offering.

Clusterware is Serious Business
As I pointed out in my previous blog entry about Oracle Clusterware, processor saturation is a bad thing for Oracle Clusterware—particularly where fencing is concerned. Alejandro had this to say:

These scenarios were defined to train a group of DBA’s to perform recovery, rather than to test the clusterware itself. When we introduced RAC & ASM we did run stress & resilience tests. The starvation test you suggest is a good one, I have seen that happening at customer sites on production environments. Thanks for your comments.

Be Mean!
If you are involved with a pre-production testing effort involving clustered Oracle, remember, be evil! Don’t force failover by doing operational things like shutting down a server or killing Oracle clusterware processes. You are just doing a functional test when you do that. Instead, create significant server load with synthetic tests such as wild loops of dd(1) to /dev/null using absurdly large values assigned to the ibs argument or shell scripts that fork children but don’t wait for them. Run C programs that wildly malloc(2) memory, or maybe a little stack recursion is your flavor—force the system into swapping, etc. Generate these loads on the server you are about to isolate from the network for instance. See what the state of the cluster is afterwards. Of course, you can purposefully execute poorly tuned Parallel Query workloads to swamp a system as well. Be creative.

Something To Think About
For once, it will pay off to be evil. Just make sure whatever you accept as your synthetic load generator is consistent and reproducible because once you start this testing, you’ll be doing it again and again—if you find bugs. You’ll be spending a lot of time on the phone making new friends.

RAC Expert or Clusters Expert?

Introducing the Oracle SMP Expert. What is a Spinlock?
I am not joking when I tell you that I met an individual last year that billed himself as an “Oracle SMP expert.” That is fine and dandy, but through the course of our discussion I realized that this person had a severely limited understanding of the most crucial concept in SMP software scalability—critical sections. It wasn’t necessarily the concept of critical sections this individual didn’t really understand, it was the mutual exclusion that must accompany critical sections on SMP systems. In Oracle terms, this person could not deliver a coherent definition for what a latch is—that is, he didn’t understand what a spinlock was and how Oracle implements them. An “Oracle SMP expert” that lacks even cursory understanding of mutual exclusion principles is an awful lot like a “RAC expert” that does not have a firm understanding of what the term “fencing” means.

I have met a lot of “RAC experts” in the last 5 years who lack understanding of clusters principles—most notably what the term “fencing” is and what it means to RAC. Fencing is to clusters what critical sections are to SMP scalability.

Is it possible to be a “RAC expert” without being a cluster expert? The following is a digest of this paper about clusterware I have posted on the Oaktable Network website. For that matter, Julian Dyke and Steve Shaw accepted some of this information for inclusion in this RAC book.

Actually, I think getting it in their book was a part of the bribe for the technical review I did of the book (just joking).

I Adore RAC and Fencing is a Cool Sport!
No, not that kind of fencing. Fencing is a generic clustering term relating to how a cluster handles nodes that should no longer have access to shared resources such as shared disk. For example, if a node in the cluster has access to shared disk but has no functioning interconnects; it really no longer belongs in the cluster. There are several different types of fencing. The most common type came from academia and is referred to by the acronym STOMITH which stands for Shoot The Other Machine In The Head. A more popular variant of this acronym is STONITH where “N” stands for Node. While STONITH is a common term, there is nothing common with how it is implemented. The general idea is that the healthy nodes in the cluster are responsible for determining that an unhealthy node should no longer be in the cluster. Once such a determination is made, a healthy node takes action to power cycle the errant node. This can be done with network power switches for example. All told, STONITH is a “good” approach to fencing because it is generally built upon the notion that healthy nodes monitor and take action to fence unhealthy nodes.

This differs significantly from the “fencing” model implemented in Oracle Clusterware, which doesn’t implement STONITH at all. In Oracle Clusterware, nodes fence themselves by executing the reboot(8) command out of the /etc/init.d/init.cssd. This is a very portable approach to “fencing”, but it raises the question of what happens if the node is so unhealthy that it cannot successfully execute the reboot(8) command. Certainly we’ve all experienced systems that were so incapacitated that commands no longer executed (e.g., complete virtual memory depletion, etc.). In a cluster it is imperative that nodes be fenced when needed, otherwise they can corrupt data. After all, there is a reason the node is being fenced. Having a node with active I/O paths to shared storage after it is supposed to be fenced from the cluster is not a good thing.

Oracle Clusterware and Vendor Clusterware in Parallel
On all platforms, except Linux and Windows, Oracle Clusterware can execute in an integrated fashion with the host clusterware. An example of this would be Oracle10g using the libskgx[n/p] libraries supplied by HP for the MC ServiceGuard environment. When Oracle runs with integrated vendor clusterware, Oracle makes calls to the vendor-supplied library to perform fencing operations. This blog post is about Linux, so the only relationship between vendor clusterware and Oracle clusterware is when Oracle-validated compatible clusterware runs in parallel with Oracle Clusterware. One such example of this model is Oracle10g RAC on PolyServe Matrix Server.

In situations where Oracle’s fencing mechanism is not able to perform its fencing operation, the underlying validated host clusterware will fence the node, as is the case with PolyServe Matrix Server. It turns out that the criteria used by Oracle Clusterware to trigger fencing are the same criteria that host clusterware uses to take action. Oracle instituted the Vendor Clusterware Validation suites to ensure that underlying clusterware is compatible and complements Oracle clusterware. STONITH is one form of fencing, but far from the only one. PolyServe supports a sophisticated form of STONITH where the healthy nodes integrate with management interfaces such as Hewlett-Packard’s iLO (Integrated Lights-Out) and Dell DRAC. Here again, the most important principle of clustering is implemented—healthy nodes take action to fence unhealthy nodes— which ensures that the fencing will occur. This form of STONITH is more sophisticated than the network power-switch approach, but in the end they do the same thing—both approaches power-cycle unhealthy nodes. However, it is not always desirable to have an unhealthy server power-cycled just for the sake of fencing.

Fabric Fencing
With STONITH, there could be helpful state information lost in the power reset. Losing that information may make cluster troubleshooting quite difficult. Also, if the condition that triggered the fencing persists across reboots, a “reboot loop” can occur. For this reason, PolyServe implements Fabric Fencing as the preferred option for customers running Real Application Clusters. Fabric Fencing is implemented in the PolyServe SAN management layer. PolyServe certifies a comprehensive list of Fiber Channel switches that are tested with the Fabric Fencing code. All nodes in a PolyServe cluster have LAN connectivity to the Fiber Channel switches. With Fabric Fencing, healthy nodes make SNMP calls to the Fiber Channel switch to disable all SAN access from unhealthy nodes. This form of fencing is built upon the sound principle of having healthy servers fence unhealthy servers, but the fenced server is left in an “up” state—yet completely severed from shared disk access. Administrators can log into it, view logs and so on, but before the node can rejoin the cluster, it must be rebooted.

Kernel Mode Clusterware
The most important aspect of host clusterware, such as PolyServe, is that it is generally implemented in Kernel Mode. In the case of PolyServe, the most critical functionality of SAN management, cluster filesystem, volume manager and so on are implemented in Kernel Mode on both Linux and Windows. On the other hand, when fencing code is implemented in User Mode, there is always the risk that the code will not get processor cycles to execute. Indeed, with clusters in general, overly saturated nodes often need to be fenced because they are not responding to status requests by other nodes in the cluster. When nodes in the cluster are getting so saturated as to trigger fencing, having critical clusterware code execute in Kernel Mode is a higher level of assurance that the fencing operation will succeed. That is, if all the nodes in the cluster are approaching a critical state and a fencing operation is necessary against an errant node, having Kernel Mode fencing architected as either robust STONITH or Fabric Fencing ensures the correct action will take place.

Coming Soon
What about SCSI-III Persistent Reservation. Isn’t I/O fencing as good as server fencing? No, it isn’t.


DISCLAIMER

I work for Amazon Web Services. The opinions I share in this blog are my own. I'm *not* communicating as a spokesperson for Amazon. In other words, I work at Amazon, but this is my own opinion.

Enter your email address to follow this blog and receive notifications of new posts by email.

Join 747 other subscribers
Oracle ACE Program Status

Click It

website metrics

Fond Memories

Copyright

All content is © Kevin Closson and "Kevin Closson's Blog: Platforms, Databases, and Storage", 2006-2015. Unauthorized use and/or duplication of this material without express and written permission from this blog’s author and/or owner is strictly prohibited. Excerpts and links may be used, provided that full and clear credit is given to Kevin Closson and Kevin Closson's Blog: Platforms, Databases, and Storage with appropriate and specific direction to the original content.

%d bloggers like this: