Archive for the 'oracle' Category


Blog Content and Format Change Announcement

This is just a quick announcement to point out that I have done a little format clean-up on the blog. The blog is about clustering and other platform topics related to Oracle, but the fact of the matter is that most IT shops that care about Oracle platform (especially clustering) topics also likely deploy non-Oracle databases.

So, I am going to start posting some stuff here along those lines. Yes, the first thing I’ve just posted there is about SQL Server 2005 consolidation and scale-out (shared database concurrent) reporting with SQL Server 2005.  This page has a whitepaper that covers new SQL Server 2005 functionality which allows databases in the PolyServe Database Utility for SQL Server to scale-out for concurrent reporting on up to 16 servers in the cluster. Switching from normal OLTP mode to scale-out reporting mode does not require any replication or structural changes to the data and the mode change occurs in less than 1 minute. Switching back to normal OLTP mode is just the opposite operation and also takes less than one minute. There are no physical storage manipulations (e.g., filesystem remounting) and no server reboots involved.

The clusterdeconfig Tool: Completely Cleaning Up After a Botched Oracle Clusterware Installation

I haven’t seen a lot of chatter about the Oracle Database Deinstallation Tool for Oracle Clusterware and Real Application Clusters on the web. In fact, a search in Metalink for the name of the actual tool—clusterdeconfig—returned no documents or Metalink forum threads with mention of the tool. I found that to be strange. This is a very helpful tool because things can go wrong when installing CRS and having a deinstall tool is better than the typical wild rm(1) command execution that is usually necessary to get back to a clean state for an installation retry.

Finding the Tool
That was a chore but I did find it so I thought I’d pass on a link to you. The following is a link to the Zip file. I hope you have a fast internet connection because it is over 60MB:

http://web51-01.oracle.com/otndocs/products/clustering/deinstall/clusterdeconfig.zip

The sshUserSetup.sh Script
When you unzip the clusterdeconfig.zip file you’ll notice it contains a script called sshUserSetup.sh that you may find helpful in setting up pass-through ssh.

Real Priorities Today
There, I blogged. But the real priority today is to go get some Dim Sum…so I’m about to shut off my lapt <fizzt>

A Successful Application of 10.2.0.3 CRS Patchset on RHEL4 x86_64. So?

Upgrading CRS to 10.2.0.3 on RHEL4 x86_64
It is quite likely I’m the last person to get around to updating my 10gR2 CRS—er, clusterware—with the 10.2.0.3 patchset. Why? Well, upgrades always break something and since 10.2.0.1 CRS was really quite stable for the specific task of node membership services (libskgxn.so), I was happy to stay with it and skip 10.2.0.2. Compared to the offal we referred to as 10.1 CRS, I have been very happy with 10gR2 CRS for the main job of CRS (which is monitoring node health). Fencing is another topic as I’ve blogged about before.

Oh, Great, He’s Blogging Screen Shots of Stuff Working Fine
Well, I can’t think of anything more boring to look at than a screen shot of a successful execution of an upgrade script. With the 10.2.0.3 upgrade it is root102.sh—the root script that OUI instructs you to execute in $ORA_CRS_HOME after it finishes such activities as copying pre-10.2.0.3 files over to ${ORA_CRS_HOME}/install/prepatch10203 and so on. So why am I blogging on a successful application of this patchset?

Knowing How Bad Something Has Failed—and Where
Often times when RAC installation and patch applications go awry—a very frequent ordeal—it is often nice to see what you should have seen at the point where it went wrong. Such clues can sometimes be helpful. It is for this reason that when I—and others in my group—write install guides for Oracle products on our Database Utility for Oracle clustering package I often include a lot of boring screen shots.

Testing a Rolling Application of 10.2.0.3 CRS
As described later in this post it is fully supported to implement a shared ORA_CRS_HOME—as it is on OCFS2 and Red Hat GFS. In fact, there are several permutations of supported configurations to choose from:

  • Local CRS HOME, raw disk OCR/CSS
  • Local CRS HOME, CFS OCR/CSS
  • Local CRS HOME, NFS OCR/CSS
  • Shared CRS HOME, raw disk OCR/CSS
  • Shared CRS HOME, CFS OCR/CSS
  • Shared CRS HOME, NFS OCR/CSS

As a normal part of my testing, I wanted to make sure the storing the OCR and CSS disks on the PolyServe CFS in no way impacts the ability to perform a 10.2.0.3 rolling upgrade of local ORA_CRS_HOME installations. It doesn’t. First, OUI determined is was OK for me to do so because ORA_CRS_HOME on all three nodes of this puny little cluster were installed under /opt on the internal drives. The CRS files (e.g., OCR/CSS), on the other hand, were on PolyServe:

tmr6s15:/opt/oracle/crs/install # grep u02 *
paramfile.crs:CRS_OCR_LOCATIONS=/u02/crs/ocr.dbf
paramfile.crs:CRS_VOTING_DISKS=/u02/crs/css1.dbf,/u02/crs/css2.dbf,/u02/crs/css3.dbf
rootconfig:CRS_OCR_LOCATIONS=/u02/crs/ocr.dbf
rootconfig:CRS_VOTING_DISKS=/u02/crs/css1.dbf,/u02/crs/css2.dbf,/u02/crs/css3.dbf
tmr6s15:/opt/oracle/crs/install # mount | grep u02
/dev/psd/psd1p3 on /u02 type psfs (rw,dboptimize,shared,data=ordered)

The first screen shot shows what to expect when OUI determines a rolling application of this patch is allowed:

NOTE: You may have to right click->view the image (e.g., with firefox I believe)

CRS1

Next, OUI instructs you to stop CRS on a node and then execute the root102.sh script:

CRS2

If all that goes well, you’ll see the following sort of feedback as root102.sh does its work:

CRS3

I was able to move along to the other two nodes and get the same feedback from root102.sh there as well.

To Share or Not to Share ORA_CRS_HOME
Oracle and PolyServe fully support the installation of CRS in either shared or unshared filesystems. The choice is up to the administrator. There are important factors to consider when making this decision. Using a shared ORA_CRS_HOME facilitates a single, central location for maintenance and operations such as log monitoring and so on. Some administrators consider this a crucial factor on larger clusters; it eliminates the need to monitor large numbers of ORA_CRS_HOME locations, each requiring logging into a different server. When ORA_CRS_HOME is shared in the PolyServe cluster filesystem, administrators can access the files from any node in the cluster.

A shared ORA_CRS_HOME does have one important disadvantage—rolling patch application is not supported. However, a patch that manipulates the Oracle Cluster Repository cannot be applied in a rolling fashion anyway. Although 10.2.0.3 is not that such a patch, it is not inconceivable that other upgrades could make format changes to the OCR that that would be incompatible with the prior-versions executing on other nodes. Oracle would, of course, inform you that such a release was not a candidate for rolling upgrade just as they do with a good number of the Critical Patch Updates (CPU).
The parallel to shared ORACLE_HOME is apparent. Many Oracle patches for the database require updates to the data dictionary, so a lot of administrators ignore the exaggerated messaging from Oracle Corporation regarding “Rolling Upgrades” of ORACLE_HOME and deploy a shared ORACLE_HOME, eliminating the need to patch several ORACLE_HOME locations whenever a patch is required. This concern is only obvious to large IT shops where there is not just one RAC database, but perhaps 10 or more. These same administrators generally apply this logic to ORA_CRS_HOME. Indeed, having only one location to patch in either the ORA_CRS_HOME or ORACLE_HOME case significantly reduces the time it takes to apply a patch. To that end, planning a very brief outage to apply patches to shared ORA_CRS_HOME and/or ORACLE_HOME for up to 16 nodes in a cluster is an acceptable situation for many applications. For those cases where downtime cannot be tolerated, Oracle Data Guard is required anyway and again the question of shared or unshared ORACLE_HOME and ORA_CRS_HOME arises. The question can only be answered on a per-application basis and the choice is yours. PolyServe finds that, in general, when an application is migrated from a single large UNIX platform to RAC on Linux, administrators do not have sufficient time to deal with the increased amount of software maintenance. These IT shops generally opt for the “single system feel” that shared software installs for ORACLE_HOME and ORA_CRS_HOME offers. In fact, PolyServe customers have used Share Oracle Home since 2002 with Oracle9i and then with Oracle10g—it has always been a staple feature of the Database Utility for Oracle. With Oracle10g the choice is yours.

Using The cpuid(1) Linux Command for In-depth Processor Information

Not to be confused with the x86 ISA CPUID instruction (which serialized the CPU by the way), I found a nice little tool for in-depth CPU information called cpuid(1).I’ve snipped a bit of the manpage and pasted it below. The RPM for the cpuid(1) tool can be found here.

Let’s take a quick look at the contrast between what this tool reports and what is generically available if you can /proc/cpuinfo. Once again, I’ll go over to my favorite lab cluster of DL585s fit with Opteron 850s running the PolyServe Database Utility for Oracle. I’ll use more(1) to get one processor worth of information:

$ cat /proc/cpuinfo | more
processor : 0
vendor_id : AuthenticAMD
cpu family : 15
model : 33
model name : AMD Opteron ™ Processor 850
stepping : 0
cpu MHz : 1800.005
cache size : 1024 KB
physical id : 0
siblings : 2
core id : 0
cpu cores : 2
fpu : yes
fpu_exception : yes
cpuid level : 1
wp : yes
flags : fpu vme de pse tsc msr pae mce cx8 apic sep mtrr pge mca cmov pat pse36 clflush mmx fxsr sse
sse2 ht syscall nx mmxext lm 3dnowext 3dnow pni
bogomips : 3599.35
TLB size : 1088 4K pages
clflush size : 64
cache_alignment : 64
address sizes : 40 bits physical, 48 bits virtual
power management: ts fid vid ttp

On the other hand, the cpuid(1) command shows:

$ cpuid | more

CPU 0:
vendor_id = “AuthenticAMD”
version information (1/eax):
processor type = primary processor (0)
family = Intel Pentium 4/Pentium D/Pentium Extreme Edition/Celeron/Xeon/Xeon MP/Itanium2, AMD At
hlon 64/Athlon XP-M/Opteron/Sempron/Turion (15)
model = 0x1 (1)
stepping id = 0x0 (0)
extended family = 0x0 (0)
extended model = 0x2 (2)
(simple synth) = AMD Dual Core Opteron (Italy/Egypt JH-E1), 940-pin, 90nm
miscellaneous (1/ebx):
process local APIC physical ID = 0x0 (0)
cpu count = 0x2 (2)
CLFLUSH line size = 0x8 (8)
brand index = 0x0 (0)
brand id = 0x00 (0): unknown
feature information (1/edx):
x87 FPU on chip = true
virtual-8086 mode enhancement = true
debugging extensions = true
page size extensions = true
time stamp counter = true
RDMSR and WRMSR support = true
physical address extensions = true
machine check exception = true
CMPXCHG8B inst. = true
APIC on chip = true
SYSENTER and SYSEXIT = true
memory type range registers = true
PTE global bit = true
machine check architecture = true
conditional move/compare instruction = true
page attribute table = true
page size extension = true
processor serial number = false
CLFLUSH instruction = true
debug store = false
thermal monitor and clock ctrl = false
MMX Technology = true
FXSAVE/FXRSTOR = true
SSE extensions = true
SSE2 extensions = true
self snoop = false
hyper-threading / multi-core supported = true
therm. monitor = false
IA64 = false
pending break event = false
feature information (1/ecx):
PNI/SSE3: Prescott New Instructions = true
MONITOR/MWAIT = false
CPL-qualified debug store = false
VMX: virtual machine extensions = false
Enhanced Intel SpeedStep Technology = false
thermal monitor 2 = false
context ID: adaptive or shared L1 data = false
cmpxchg16b available = false
xTPR disable = false
extended processor signature (0x80000001/eax):
generation = AMD Athlon 64/Opteron/Sempron/Turion (15)
model = 0x1 (1)
stepping = 0x0 (0)
(simple synth) = AMD Dual Core Opteron (Italy/Egypt JH-E1), 940-pin, 90nm
extended feature flags (0x80000001/edx):
x87 FPU on chip = true
virtual-8086 mode enhancement = true
debugging extensions = true
page size extensions = true
time stamp counter = true
RDMSR and WRMSR support = true
physical address extensions = true
machine check exception = true
CMPXCHG8B inst. = true
APIC on chip = true
SYSCALL and SYSRET instructions = true
memory type range registers = true
global paging extension = true
machine check architecture = true
conditional move/compare instruction = true
page attribute table = true
page size extension = true
multiprocessing capable = false
no-execute page protection = true
AMD multimedia instruction extensions = true
MMX Technology = true
FXSAVE/FXRSTOR = true
SSE extensions = true
RDTSCP = false
long mode (AA-64) = true
3DNow! instruction extensions = true
3DNow! instructions = true
extended brand id = 0xe86 (3718):
MSB = reserved (0b111010)
NN = 0x6 (6)
AMD feature flags (0x80000001/ecx):
LAHF/SAHF supported in 64-bit mode = false
CMP Legacy = true
SVM: secure virtual machine = false
AltMovCr8 = false
brand = “AMD Opteron ™ Processor 850”
L1 TLB/cache information: 2M/4M pages & L1 TLB (0x80000005/eax):
instruction # entries = 0x8 (8)
instruction associativity = 0xff (255)
data # entries = 0x8 (8)
data associativity = 0xff (255)
L1 TLB/cache information: 4K pages & L1 TLB (0x80000005/ebx):
instruction # entries = 0x20 (32)
instruction associativity = 0xff (255)
data # entries = 0x20 (32)
data associativity = 0xff (255)
L1 data cache information (0x80000005/ecx):
line size (bytes) = 0x40 (64)
lines per tag = 0x1 (1)
associativity = 0x2 (2)
size (Kb) = 0x40 (64)
L1 instruction cache information (0x80000005/ecx):
line size (bytes) = 0x40 (64)
lines per tag = 0x1 (1)
associativity = 0x2 (2)
size (Kb) = 0x40 (64)
L2 TLB/cache information: 2M/4M pages & L2 TLB (0x80000006/eax):
instruction # entries = 0x0 (0)
instruction associativity = L2 off (0)
data # entries = 0x0 (0)
data associativity = L2 off (0)
L2 TLB/cache information: 4K pages & L2 TLB (0x80000006/ebx):
instruction # entries = 0x200 (512)
instruction associativity = 4-way (4)
data # entries = 0x200 (512)
data associativity = 4-way (4)
L2 unified cache information (0x80000006/ecx):
line size (bytes) = 0x40 (64)
lines per tag = 0x1 (1)
associativity = 16-way (8)
size (Kb) = 0x400 (1024)
Advanced Power Management Features (0x80000007/edx):
temperature sensing diode = 0x1 (1)
frequency ID (FID) control = 0x1 (1)
voltage ID (VID) control = 0x1 (1)
thermal trip (TTP) = 0x1 (1)
thermal monitor (TM) = 0x0 (0)
software thermal control (STC) = 0x0 (0)
TscInvariant = 0x0 (0)
Physical Address and Linear Address Size (0x80000008/eax):
maximum physical address = 0x28 (40)
maximum linear address = 0x30 (48)
Logical CPU cores (0x80000008/ecx):
number of logical CPU cores – 1 = 0x1 (1)
ApicIdCoreIdSize = 0x0 (0)
SVM Secure Virtual Machine (0x8000000a/eax):
SvmRev: SVM revision = 0x0 (0)
SVM Secure Virtual Machine (0x8000000a/edx):
LBR virtualization = false
NASID: number of address space identifiers = 0x0 (0):
(multi-processing synth): multi-core (c=2)
(synth) = AMD Dual Core Opteron (Italy/Egypt JH-E1), 940-pin, 90nm Processor 875

And the manpage:


CPUID(1)
NAME

cpuid – Dump CPUID information for each CPU

SYNOPSIS

cpuid [options…]

DESCRIPTION

cpuiddumpsdetailedinformationabouttheCPU(s) gathered from the CPUID instruction, and also determines the exact model of CPU(s) from that information.

It dumps all information available from the CPUID instruction.The exact collectionofinformation availablevariesbetweenmanufacturers and even between different CPUs from a single manufacturer.

The following information is available consistently on all modern CPUs:

vendor_id

version information (1/eax)

miscellaneous (1/ebx)

feature information (1/ecx)

Oracle Database on CAS, NAS, FCP. Your Choice. Why Not Some of Each?

When it comes to storage protocols, the big storage vendors are sending a clear message: Some is good, more must be better!

NAS, CAS, What a Mess (That Almost Rhymes)
Yes, Oracle cares about Oracle over NFS, and clustered storage is taking off, but the clustered storage offerings are fracturing into structured versus unstructured data optimization and that is a bad choice to have to make.

Back in June 2006, Tony Asaro of the Enterprise Storage Group covered clustered storage in this SearchStorage.com article. He said:

Clustered storage is gaining ground with an increasing number of vendors and systems in today’s market. Over time, clustered storage will be a requisite architectural design element for all storage systems.

The article covers a lot of different clustered storage offerings running the gamut from products like Isilon to CAS technology such as the EMC Centera and mention of PolyServe oddly listed alongside 3Par who partners with PolyServe for scalable NAS. One particular quote in the article stands out:

The Isilon IQ NAS storage system is one of the best examples of a true storage cluster.

Special Purpose Storage
While this may be true, I want to blog about a very important issue that I see arising out of the clustered storage wars. You see, so many of these interesting technologies are very special purpose. Some do streaming media well, others do seismic, others do RDBMS, but few—if not only one—do it all. Deploying special purpose storage technology means you are certain to have more than one kind of storage. For instance, if you adopt EMC Centera for unstructured data, you are going to need some other solution for your structured data—and since this is an Oracle blog we’ll presume Oracle is charged with your structured data.

Centera Storage is Optimized for Databases
“Hold it, Kevin”, you say. I can hear it already. I know, you read this EMC solution brief covering Centera posted on Oracle’s website! It says (emphasis added by me):

[…] Centera’s unique storage capabilities, you can centralize and manage massive volumes of information generated by all aspects of your organization […]

A document on Oracle’s website states Centera handles information generated by all aspects of your organization. Certainly that must also include the things you cram into your ERP database! No, CAS is an EMC term for write-once, or in their terminology “fixed content.” In short they implement WORM on ordinary magnetic media. Centera is not for databases.

So Oracle and EMC both recommend Centera for some of your data. How many different types of storage presentation do you want? What do you do with your database then? Oh, of course, I know, ASM. Centera is a network attached storage device so if you are settling on IP, wouldn’t life be simpler with NAS for the database too? But as I pointed out in this blog entry about ASM over NFS, EMC specifically recommends against combining ASM and NFS. So how many different connectivity models do you want? See, what I don’t get is how the market tolerates having products marketed to them in a way that doesn’t have their best interests in mind. It suits EMC quite well to sell you some Centera and some Celerra for NFS or even a mix of Centera and DMX via FCP (FCP is expensive). Any storage vendor that pushes Content DB will get a head nod from Oracle, but in the end, Content DB runs on all major platforms. So who are the forces behind this drive towards such special purpose and fractured storage management architectures?

Unlike Isilon and EMC file serving, with PolyServe you can buy any commodity hardware. And unlike Isilon and EMC, you can choose Windows Server or Linux—no proprietary embedded operating system. And most importantly—unlike Isilon and EMC—with PolyServe you get general purpose network attached clustered storage. So, sure, do your Content DB and Oracle Database (RAC included) all in one management infrastructure. Makes sense to me, but of course I’m biased.

Isilon: The Best Example of a True Storage Cluster
Yes, Isilon is a true clustered storage, but the product doesn’t support the Oracle database. Yet another special purpose offering. But, as I said here, I wish Isilon well. We are, after all, kindred spirits in this clustered storage wave. 

OK, there, I shamelessly plugged the outfit I work for <smiley face>.


Geeks in Cubicles, The “Browser Wars”, Unpaid Workers are “Truly Dedicated”

The Browser Wars Rage On
While reading the latest Time Magazine about how you are the person of the year, I stumbled across some interesting stuff. In this Time Magazine article, we learn that Blake Ross is “Outfoxing Microsoft” with the Firefox web brower. Are there really any living human beings left that care about the “browser wars”? I thought it was all about content now. Oh, Well.

Near the beginning of the article, we get this jewel regarding how most software is developed:

Most software is developed exactly the way you think it is: you pay a bunch of geeks in cubicles to write it

Lovely. On the contrary when referring to some of the people that write open source software, the article quotes Blake:

[open source developers] aren’t necessarily professionals

But no worries, when it comes to the commitment level of open source developers, the article quotes Blake as follows:

It also means the people are truly dedicated because there’s no payday

Uh, OK, that’s really nifty. I don’t know about you, but I’m a lot happier with software developed by people that do it because they need to meet their financial obligations. The thought of my local 911 service running on software written by ueber-dedicated, unpaid not-necessarily-professionals makes me restless. Think about it, they might actually have to attend to their day job at some point, or is that where they are getting the best of “their ideas?”

Oh the Hypocrisy!
I used Firefox to post this blog entry. You know what I would have used of Firefox wasn’t free? IE6—I wouldn’t pay for Firefox. When I installed Firefox, there is a welcome to Firefox page that reads:

Experience the difference. Firefox is developed and supported by Mozilla, a global community working together to make the Web a better place for everyone.

I don’t think whoever wins the nonexistent browser wars can make the Web a better place for everyone. It’s not the browser, it’s the content.

What’s This Have to do with Oracle
Oracle is not open source. I’m glad there are those “geeks in cubicles” developing and maintaining the database server. I know a lot of them, and they deserve a lot of respect.


Announcement: Scalable Windows File Serving Web Demo

Yes, this is an Oracle-related blog, but most Oracle sites have file serving requirements and the majority have Windows infrastructure as well. This is just an invitation to you readers that might be interested:

PolyServe Windows Scalable File Serving Web Demo Announcement


AMD Quad-Core “Barcelona” Processor For Oracle (Part III). NUMA Too!

To continue my thread about AMD’s future Quad-core processors code named “Barcelona” (a.k.a. K8L), I need to elaborate a bit on my last installment on this thread where I pointed out that AMDs marketing material suggests we should expect 70% better OLTP performance from Barcelona than Socket F (Opteron 2220). To be precise, the marketing materials are predicting a 70% increase on a per-processor basis. That is a huge factor that I need to blog, so here it is.

“Friendemies”
While doing the technical review for the Julian Dyke/Steve Shaw RAC on Linux Book I got to know Steve Shaw a bit. Since then we have become more familiar with each other especially after manning the HP booth in the exhibitor hall at UKOUG 2006. Here is a photo of Steve in front of the HP Enterprise File Services Clustered Gateway demo. The EFS is an OEMed version of the PolyServe scalable file serving utility (scalable clustered storage that works).

shaw_4.JPG

People who know me know I’m a huge AMD fan, but they also know I am not a techno-religious zealot. I pick the best, but there is no room for loyalty in high technology (well, on second thought, I was loyal to Sequent to the bitter end…oh well). So over the last couple of years, Steve and I have occasionally agreed to disagree about the state of affairs between Intel and AMD processor fitness for Oracle. Steve and I are starting to see eye to eye a lot more these days because I’m starting to smell the coffee as they say.

It’s All About The Core
When it comes to Oracle performance on industry standard servers, the only thing I can say is, “It’s the core, stupid”—in that familiar Clintonian style of course. Oracle licenses the database at the rate of .5 per core, rounded up. So a quad-core processor is licensed as 2 CPUs. Let’s look at some numbers.

Since AMD’s Quad-core promo video is based on TPC results, I think it is fair to go with them. TPC-C is not representative of what real applications do to a processor, but the workload does one thing really well—it exploits latency issues. For OLTP, memory latency is the most important performance characteristic. Since AMD’s material sets our expectations for some 70% improvement in OLTP over the Opteron 2200, we’ll look at TPC-C.

This published TPC-C result shows that the Opteron 2200 can perform 69,846 TpmC per processor. If the AMD quad-core promotional video proves right, the Barcelona processor will come it at approximately 118,739 TpmC per processor (a 70% improvement).

TpmC/Oracle-license
Since a quad-core AMD is licensed by Oracle as 2 CPUs, it looks like Barcelona will be capable of 59,370 TpmC per Oracle license. Therein lies the rub, as they say. There are a couple of audited TPC-C results with the Intel “Tulsa” processor (a.k.a. Xeon 7140, 7150), such as this IBM System x result, that show this current high-end Xeon processor is capable of some 82,771 TpmC per processor. Since the Xeon 71[45]0 is a dual-core processor, the Oracle-license price factor is 82,771 TpmC per Oracle license. If these numbers hold any water, some 9 months from now when Barcelona ships, we’ll see a processor that is 28% less price-performant from a strict Oracle licensing standpoint. My fear is that it will be worse than that because Barcelona is socket-compatible with Socket F systems—such as the Opteron 2200. I’ve been at this stuff for a while and I cannot imagine the same chipset having enough headroom to feed a processor capable of 70% more throughput. Also, Intel will not stand still. I am comparing current Xeon to future Barcelona.

A Word About TPC-C Analysis
I admit it! I routinely compare TPC-C results on the same processor using results achieved by different databases. For instance, in this post, I use a DB2/SLES on IBM System x to make a point about the Xeon 7150 (“Tulsa”) processor. E-gad, how can I do that with a clear conscience? Well, think about it this way. If DB2 on IBM System x running SuSE can achieve 82,771 TpmC per Xeon 7150 and this HP result shows us that SQL Server 2005 on Proliant ML570G4 (Xeon 7140) can do 79,601 TpmC per CPU, you have to at least believe Oracle would do as well. There are no numbers anywhere that suggest Oracle is head and shoulders above either of these two software configurations on identical hardware. We can only guess because Oracle seems to be doing TPC-C with Itanium exclusively these days. I think that is a bummer, but Steve Shaw likes it (he works for Intel)!

What Does NUMA Have To Do With It?
Uh, Opteron/HyperTransport systems are NUMA systems. I haven’t blogged much about that yet, but I will. I know a bit about Oracle on NUMA—a huge bit.

I hope you’ll stay tuned because we’ll be looking at real numbers.

The “Dread Factor”, Multi-vendor Support, Unbreakable Linux.

Dread the Possible, Ignore the Probable
“One throat to choke”, is the phrase I heard the last time I spoke with someone who went to extremes to reduce the number of technology providers in their production Oracle deployment. You know, Unbreakable Linux, single-source support provider, etc. I’m sorry, but, if you are running Oracle on Linux there is no way to get single-provider support. We all find this out sooner or later. Sure, you can send your money to a sole entity, but that is just a placebo. If I thought my life depended on single-provider support, I’d buy an IBM System i solution (AS400)—soup to nuts. At least I’d get close.

With Linux there is always going to be multiple providers because it runs on commodity hardware. You then add storage (SAN array, switches, HBAs), load the OS and Oracle and other software. There you go—multiple providers. So why is it that sometime people get a comfort from this theory of single-provider support on the software (OS and Oracle only of course) side of things? Is it a reality?

Dread Factor
No, single-provider support with Oracle on Linux is not a reality. That is why serious software providers and their careful customers rely on TSANet to ensure all parties play by the rules and do not start pointing fingers at the expense of the customer. Oracle is a participant in TSANet, so is PolyServe.

I was reading an interesting magazine article—also available online—about how we humans fear the wrong things. You know, things like fearing a commercial airliner fatality more than an auto fatality—the latter taking 500-fold more lives per year. The article explains why. We dread an airliner crash more. The article points out:

[…] the more we dread, the more anxious we get, and the more anxious we get, the less precisely we calculate the odds of the thing actually happening. “It’s called probability neglect,”

What Does This Have To Do With Oracle?
Well, we fear how “helpless” we might be in a case where the OS or third party platform software provider is pointing at Oracle and Oracle is pointing back. By the way, have you ever finger-pointed at a 800lb gorilla? Yes that is a possible scenario. Is that somehow more calamitous than working with Oracle on a clear, concise Oracle-only bug (e.g., some ORA-0600 crash problem)? Probably not, but fear of the former is an example of what the magazine article calls the Dread Factor.

New Year’s Resolution: Fear the Probable
We have a Wall Street customer that does not run Oracle on our Database Utility for Oracle RAC, in their RAC solution but do use our scalable file serving in their ETL workflow. They run Oracle on Itanium Linux and we don’t do Itanium. But, since we are in there, I know a bit about their operations. In the month of November 2006, one of their operations managers told me they had nearly 90 Oracle TARs open—half of which where ORA-00600/ORA-07445 problems. All those TARs were affecting a single application—a single RAC database. Yes, it is conceivable that they also have also faced a multi-vendor problem (e.g., HBA firmware/Red Hat SCSI midlayer) at some point in this deployment. Do you think they really care? In this shop, the database tier is 100% Unbreakable Linux—the old style, not the new style. The old style Unbreakable Linux being RHEL with Oracle and no third-party kernel loadable modules. That’s them–they have a “single throat to choke”. How do you think that is working out for them? It hasn’t made a bit of difference.

Oracle is an awesome database. It is huge and complex. You are going to hit bugs so it might be a good New Year’s resolution to fear the probable more then the possible. Get the most stable, managable, supported configuration you can so that you are not dealing with day to day headaches between those probable bugs. That is, don’t hinge your deployment on some possible support finger pointing match. Real, difficult, single-vendor bugs are most probable. Choose your partners well for those possible bugs.

A Case Study
The majority of the suse-oracle email list participants have the “no-third-party” model deployed. They are, if you will, the poster children for Unbreakable Linux. So I keep an eye out there to see how the theory plays out in reality. Let’s take a peek. In a recent thread about an Asynchronous I/O problem in the Linux kernel, the poster wrote:

We already tried this…opened a TAR with Oracle, opened an issue with Novell…got 2 fixes from Novell, but both are not helping around the bug. The database crashes after approx. 1 week of heavy load and you have to restart the machine to free the ipc-resources.

Remember that with an Unbreakable Linux deployment, if you hit a Linux kernel problem you can call Oracle or the provider of your Linux distribution. This person tried both, but the saga continued:

[…] we filed a bug…with both parties, Novell AND Oracle.We escalated this case at Novell, because it’s a kernel bug…no change for the last 4-6 weeks. But…as you see…no solution after about 3 months…

Since Linux is open source, the code is open to all for reading. I’ve blogged before about the dubious value in being able to read the source for the OS or layers such as clustered filesystems since an IT shop is not likely to fix the problem themselves anyway. The customer having this async I/O problem took advantage of that “benefit”:

I took a deep look into the kernel-code, especially the part of the bug in aio.c As far as i see, it looks like a list-corruption of the list of outstanding io-requests. So i don’t think that it is driver-specific…it looks like a general bug.

But, as I routinely point out, having the source really doesn’t help an IT shop much as this installment on the thread shows:

It’s very unfortunate that this bug (bz #165140) is still not resolved
as both Oracle and SUSE eng. teams are looking into problem.

An Historical Example of Good Multi-Vendor Support
Back in the 1990’s Veritas, Oracle and Sun got together to build a program called VOS to ensure their joint customers get the handling they deserve. Kudos to Oracle and Sun. That was typical of Oracle back in the Open Systems days. Things were a lot more “open” back then.

I participate in the oracle-l list. There was a recent thread there about the dreaded “finger-pointing” illusion. In this post a list participant set the record straight. His post points out that having more than “one through to choke” is better than being all alone:

In the context of clustering, even if you eliminate the third-party cluster-ware products, you still have the other pieces of the pie, like the OS, the storage (SAN, etc.), the interconnect, etc., so the finger-pointing will not go away. I have worked with the VOS support many times in the past and I can tell you that in each conference call, VERITAS support never pointed fingers towards anyone. In fact, their support people were so competent that they even identified issues that were related to SAN and even the analysts from the storage SAN company were not able to identify them.


Lessons From Real Life
Multi-vendor support is a phenomenon across all industries. A good friend of mine has a real job and does real work for a living—dangerous work, with huge dangerous equipment that he owns. He knows that there are certain things he has to do with his machinery that substantially increase the probability of something going wrong. In those cases, he doesn’t fret about the possibility that there may be some political outcome. He focuses on the probable.

A bit over a year ago he experienced “the probable” and took photos for me. While moving a 60,000+ lb piece of machinery, he hit a patch of ice and yes, 30 ton track vehicles do slide on ice just like your co-worker’s red sports car.

In the following shot, the machinery had just slipped off the road so he called in another of his pieces to help.

cat1

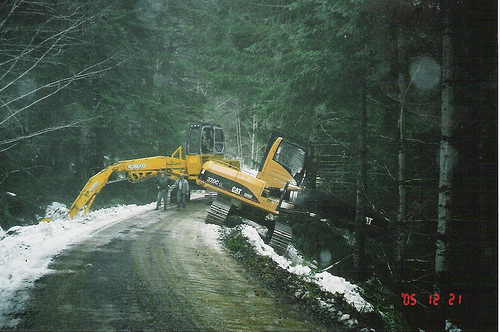
In the next shot they had worked at the problem until the tracks were headed in the right direction and the tether was freshly cut loose. He said the anxiety was so thick you could cut it with a knife. It is quite probable he is right. Then again, it is possible he was exaggerating. I’ll let you be the judge.

cat2
I’ll blog another time about where that machine had to go after that photo…it wasn’t pretty.

AMD Quad-core “Barcelona” Processor For Oracle (Part II)

I am a huge AMD fan, but I am now giving up my hopes of finding any substantial information that could be used to predict what Oracle performance might be like on next year’s Barcelona (a.k.a. K8L) quad-core processor. I did, however, find another ” interesting blog” while trolling for information on this topic. Note, the quotes! Folks, NOTE THE QUOTES!!! I’m insinuating something there…

Lowered Expectations?
Anyway, what I am finding is that by AMD’s own predictions, we should expect Barcelona to outperform Intel’s Clovertown (Xeon 5355) processor by about 15% or so. The problem is that there really are no real numbers. You can view this AMD video about Barcelona. In it you’ll find a slide that shows their estimated 70% OLTP improvement over the Opteron 2200 SE product. The 2200 is a Socket F processor and luckily for us there is an audited TPC-C result of 34,923 TpmC/core. Note, I’m boiling down TPC results by core to make some sense of this. The Barcelona processor is 100% compatible with the Socket F family. I find it hard to imagine that Barcelona will be able to squeeze out a 70% performance increase from the same chipset. Oh well. But if it did, that would be a TPC-C result of 59,369 per core. So why then is that AMD video so focused on leap-frogging the Xeon 5355 which “only” gets 30,092 TpmC/core? And why the fixation on the Xeon 5355 when the Xeon 7140 “Tulsa” achieves 39,800 TpmC/core? It was nice and convenient to be able to compare the 2200SE, 5355 and 7140 with TPC results based on the same database—SQL Server.

I also see no evidence of IBM, HP or Dell planning to base a server on Barcelona. That’s scary. I’m expecting some quasi-inside information from Sun. Let’s see if that will help any of this make sense.

The following is shot of the AMD slide predicting 70% performance over the Xeon 5160 and Opteron 2200SE (which as I point out is a bit moot). You may have to right-click and view to zoom in on it:

AMD-Barcelona2

OLTP is Old News
Finally, I’m discovering that you don’t get much information about processors when searching for that old, boring OLTP stuff. If I search for “megatasking +AMD” on the other hand—now that produces a richness of information! I’ve also learned that “enthusiast” is a buzzword AMD and Intel are both beating on heavily. I was completely unaware that there is actually what is known as an “enthusiast market”. It seems customers in this particular market buy processors that also wind up in servers for OLTP. I just hope the processors they are making for “enthusiasts” are also reasonably fit for Oracle databases. I’m afraid we aren’t going to know until we find out.

In the meantime, I think I’ll push some megatasking tests through my cluster of DL585s.

Partition, or Real Application Clusters Will Not Work.

OK, that was a come-on title. I’ll admit it straight away. You might find this post interesting nonetheless. Some time back, Christo Kutrovsky made a blog entry on the Pythian site about buffer cache analysis for RAC. I meant to blog about the post, but never got around to it—until today.

Christo’s entry consisted of some RAC theory and a buffer cache contents SQL query. I admit I have not yet tested his script against any of my RAC databases. I intend to do so soon, but I can’t right now because they are all under test. However, I wanted to comment a bit on Christo’s take on RAC theory. But first I’d like to comment about a statement in Christo’s post. He wrote:

There’s a caveat however. You have to first put your application in RAC, then the query can tell you how well it runs.

Not that Christo is saying so, but please don’t get into the habit of using scripts against internal performance tables as a metric of how “well” things are running. Such scripts should be used as tools to approach a known performance problem—a problem measured much closer to the user of the application. There are too many DBAs out there that run scripts way down-wind of the application and if they see such metrics as high hit ratios in cache, or other such metrics they rest on their laurels. That is bad mojo. It is not entirely unlikely that even a script like Christo’s could give a very “bad reading” yet application performance is satisfactory and vise versa. OK, enough said.

Application Partitioning with RAC
The basic premise Christo was trying to get across is that RAC works best when applications accessing the instances are partitioned in such a way as to not require cross-instance data shipping. Of course that is true, but what lengths do you really have to go to in order to get your money’s worth out of RAC? That is, we all recall how horrible block pings were with OPS—or do we? See, most people that loathed the dreaded block ping in OPS thought that the poison was in the disk I/O component of a ping when in reality the poison was in the IPC (both inter and intra instance IPC). OK, what am I talking about? It was quite common for a block ping in OPS to take on the order of 200-250 milliseconds on a system where disk I/O is being serviced with respectable times like 10ms. Where did the time go? IPC.

Remembering the Ping
In OPS, when a shadow process needed a block from another instance, there was an astounding amount of IPC involved to get the block from one instance to the other. In quick and dirty terms (this is just a brief overview of the life of a block ping) it consisted of the shadow process requesting the local LCK process to communicate with the remote LCK process who in turn communicated with the DBWR process on that node. That DBWR process then flushed the required block (along with all the modified blocks covered by the same PCM lock) to disk. That DBWR then posted his local LCK who in turn posted the LCK process back where the original requesting shadow process is waiting. That LCK then posts the shadow process and the shadow process then reads the block from disk. Whew. Note, at every IPC point the act of messaging only makes the process being posted runable. It then waits in line for CPU in accordance with its mode and priority. Also, when DBWR is posted on the holding node, it is unlikely that it was idle, so the life of the block ping event also included some amount of time that was spent while DBWR finished servicing the SGA flushing it was already doing when it got posted. All told, there was quite often some 20 points where the processes involved were in runable states. Considering the time quantum for scheduling is/was 10ms, you routinely got as much as 200ms overhead on a block ping that was just scheduling delay. What a drag.

What Does This Have To Do With RAC?
Christo’s post discusses divide and conquer style RAC partitioning, and he is right. If you want RAC to perform perfectly for you, you have to make sure that RAC isn’t being used. Oh he’s gone off the deep end again you say. No, not really. What I’m saying is that if you completely partition your workload then RAC is indeed not really being used. I’m not saying Christo is suggesting you have to do that. I am saying, however, you don’t have to do that. This blog post is not just a shill for Cache Fusion, but folks, we are not talking about block pings here. Cache Fusion—even over Gigabit Ethernet—is actually quite efficient. Applications can scale fairly well with RAC without going to extreme partitioning efforts. I think the best message is that application partitioning should be looked at as a method of exploiting this exorbitantly priced stuff you bought. That is, in the same way we try to exploit the efficiencies gained by fundamental SMP cache-affinity principals, so should attempts be made to localize demand for tables and indexes (and other objects) to instances—when feasible. If it is not feasible to do any application partitioning, and RAC isn’t scaling for you, you have to get a bigger SMP. Sorry. How often do I see that? Strangely not that often. Why?

Over-configuring
I can’t count how often I see production RAC instances running throughout an entire RAC cluster at processor utilization levels well below 50%. And I’m talking about RAC deployments where no attempt has been made to partition the application. These sites often don’t need to consider such deployment tactics because the performance they are getting is meeting their requirements. I do cringe and bite my tongue however when I see 2 instances of RAC in a two node cluster—void of any application partitioning—running at, say, 40% processor utilization on each node. If no partitioning effort has been made, that means there is cache fusion (GCS/GES) in play—and lots of it. Deployments like that are turning their GbE Cache Fusion interconnect into an extension of the system bus if you will. If I was the administrator of such a setup, I’d ask Santa to scramble down the chimney and pack that entire workload into one server at roughly 80% utilization. But that’s just me. Oh, actually, packing two 40% RAC workloads back into a single server doesn’t necessarily produce 80% utilization. There is more to it than that. I’ll see if I can blog about that one too at some point.

What about High-Speed, Low-Latency Interconnects?
With OLTP, if the processors are saturated on the RAC instances you are trying to scale, high-speed/low latency interconnect will not buy you a thing. Sorry. I’ll blog about why in another post.

Final Thought
If you are one of the few out there that find yourself facing a total partitioning exercise with RAC, why not deploy a larger SMP instead? Comments?

The 60% Allocation “Rule.” Oracle TPC-H Proves Hard Drives Are Still Round!

I recently blogged about the phenomenal Oracle10g TPC-H result with HP’s Itanium2 based Superdome. I just took another look at the Full Disclosure Report to see what percentage of the gross disk capacity was used for Oracle tablespaces. When allocating space from each spindle, it is always good practice to use no more than about the outer most 60% of the platters. The sectors on the outside of each platter have higher capacity than the sectors closer to the center. I know not all storage arrays allow administrators to choose the disk geometry that derives a LUN, but if it is supported, it is good practice.

The 60% Rule Lives On
This audacious TPC-H result used 3072 36GB hard drives. Yes, folks, unfortunately for databases like Oracle more small drives are better—yet most of today’s storage arrays are shipping maximum capacity with minimum spindles. Yikes! Anyway, a storage configuration with 3072 36GB drives yields a gross capacity of 108TB. As I discussed in my first post about this TPC-H results, the ASM diskgroup consisted of 256 “disks” which were actually 138GB LUNs—an ASM diskgroup of 34.5TB. Since ASM was used with external redundancy, it is safe to presume that the LUNs were mirrored so the 108TB gross yields a RAID net of 54TB. The ASM space, therefore, consumed 63.8% of the drives’ gross capacity.

Some Things Never Change
Good fundamental principles such as preferring the outer portions of those round, brown spinning things generally stand the test of time. The storage subsystem configured for this TPC-H result prices out at nearly USD $3 million and yet the same fundamental storage allocation rules are still followed.

Audited TPC results are a wealth of information. I sure used to loathe doing them though!

Using OProfile to Monitor Kernel Overhead on Linux With Oracle

Yes, this Blog post does have OProfile examples and tips, but first my obligatory rant…

When it comes to Oracle on clustered Linux, FUD abounds.  My favorite FUD is concerning where kernel mode processor cycles are being spent. The reason it is my favorite is because there is no shortage of people that likely couldn’t distinguish between a kernel mode cycle and a kernel of corn hyping the supposed cost of running Oracle on filesystem files—especially cluster filesystems. Enter OProfile.

OProfile Monitoring of Oracle Workloads
When Oracle is executing, the majority of processor cycles are spent in user mode. If, for instance, the processor split is 75/25 (user/kernel), OProfile can help you identify how the 25% is being spent. For instance, what percentage is spent in process scheduling, kernel memory management, device driver routines and I/O code paths.

System Support
The OProfile website says:

OProfile works across a range of CPUs, include the Intel range, AMD’s Athlon and AMD64 processors range, the Alpha, ARM, and more. OProfile will work against almost any 2.2, 2.4 and 2.6 kernels, and works on both UP and SMP systems from desktops to the scariest NUMAQ boxes.

Now, anyone that knows me or has read my blog intro knows that NUMA-Q meant a lot to me—and yes, my Oak Table Network buddies routinely remind me that I still haven’t started attending those NUMA 12-step programs out there. But I digress.

Setting Up OProfile—A Tip
Honestly, you’ll find that setting up OProfile is about as straight forward as explained in the OProfile documentation. I am doing my current testing on Red Hat RHEL 4 x86_64 with the 2.6.9-34 kernel. Here is a little tip: one of the more difficult steps to getting OProfile going is finding the right kernel-debug RPM. It is not on standard distribution medium and hard to find—thus the URL I’ve provided. I should think that most people are using RHEL 4 for Oracle anyway.

OProfile Examples
Perhaps the best way to help get you interested in OProfile is to show some examples. As I said above, a very important bit of information OProfile can give you is what not to worry about when analyzing kernel mode cycles associated with an Oracle workload. To that end, I’ll provide an example I took from one of my HP Proliant DL-585’s with 4 sockets/8 cores attached to a SAN array with 65 disk drives. I’m using an OLTP workload with Oracle10gR2 and the tablespaces are in datafiles stored in the PolyServe Database Utility for Oracle; which is a clustered-Linux server consolidation platform. One of the components of the Utility is the fully symmetric cluster filesystem and that is where the datafiles are stored for this OProfile example. The following shows a portion of a statpack collected from the system while OProfile analysis was conducted.

NOTE: Some browsers require you to right click->view to see reasonable resolution of these screen shots

spack


As the statspack shows, there were nearly 62,000 logical I/Os per second—this was a very busy system. In fact, the processors were saturated which is the level of utilization most interesting when performing OProfile. The following screen shot shows the set of OProfile commands used to begin a sample. I force a clean collection by executing the oprofile command with the –deinit option. That may be overkill, but I don’t like dirty data. Once the collection has started I run vmstat(8) to monitor processor utilization. The screen shot shows that the test system was not only 100% CPU bound, but there were over 50,000 context switches per second. This, of course, is attributed to a combination of factors—most notably the synchronous nature of Oracle OLTP reads and the expected amount of process sleep/wake overhead associated with DML locks, background posting and so on. There is a clue in that bit of information—the scheduler must be executing 50,000+ times per second. I wonder how expensive that is? We’ll see soon, but first the screen shot showing the preparatory commands:

opstart

So the next question to ask is how long of a sample to collect. Well, if the workload has a “steady state” to achieve, it is generally sufficient to let it get to that state and monitor about 5 or 10 minutes. It does depend on the ebb and flow of the workload. You don’t really have to invoke OProfile before the workload commences. If you know your workload well enough, watch for the peak and invoke OProfile right before it gets there.

The following screen shot shows the oprofile command used to dump data collected during the sample followed by a simple execution of the opreport command.


opdump


OK, here is where it gets good. In the vmstat(8) output above we see that system mode cycles were about 20% of the total. This simple report shows us a quick sanity check. The aggregate of the core kernel routines (vmlinux) account for 65% of that 20%–13% of all processor cycles. Jumping over the cost of running OProfile (23%) to the Qlogics Host Bus Adaptor driver we see that even though there are 13,142 IOPS, the device driver is handling that with only about 6% of system mode cycles—about 1.2% of all processor cycles.

The Dire Cost of Deploying Oracle on Cluster Filesystems
It is true that Cluster Filesystems inject code in the I/O code path. To listen to the FUD-patrol, you’d envision a significant processor overhead. I would if I heard the FUD and wasn’t actually measuring anything. As an example, the previous screen shot shows that by adding the PolyServe device driver and PolyServe Cluster Filesystem modules (psd, psfs) together there is 3.1% of all kernel mode cycles (.6% of all cycles) expended in PolyServe code—even at 13,142 physical disk transfers per second. Someone please remind me the importance of using raw disk again? I’ve been doing performance work on direct I/O filesystems that support asynchronous I/O since 6.0.27 and I still don’t get it. Anyway, there is more that OProfile can do.

The following screen shot shows an example of getting symbol-level costing. Note, I purposefully omitted the symbol information for the Qlogic HBA driver and OProfile itself to cut down on noise. So, here is a trivial pursuit question: what percentage of all processor cycles does RHEL 4 on a DL-585 expend in processor scheduling code when the system is sustaining some 50,000 context switches per second? The routine to look for is schedule() and the following example of OProfile shows the answer to the trivial pursuit question is 8.7% of all kernel mode cycles (1.7% of all cycles).

sym1

The following example shows me where PolyServe modules rank in the hierarchy of non-core kernel (vmlinux) modules. Looks like only about 1/3rd the cost of the HBA driver and SCSI support module combined.

sym2

If I was concerned about the cost of PolyServe in the stack, I would use the information in the following screen shot to help determine what the problem is. This is an example of per-symbol accounting. To focus on the PolyServe Cluster Filesystem, I grep the module name which is psfs. I see that the component routines of the filesystem such as the lock caching layer (lcl), cluster wide inode locking (cwil) and journalling are evenly distributed in weight—no “sore thumbs” sticking up as they say. Finally, I do the same analysis for our driver, PSD, and there too see no routine accounting for any majority of the total.

sym3

Summary
There are a couple of messages in this blog post. First, since tools such as OProfile exist, there is no reason not to actually measure where the kernel mode cycles go. Moreover, this sort of analysis can help professionals avoid chasing red herrings such as the fairy tales of measurable performance impact when using Oracle on quality direct I/O cluster filesystems. As I like to say, “Measure before you mangle.” To that end, if you do find yourself in a situation where you are losing a significant amount of your processor cycles in kernel mode, OProfile is the tool for you.

3PAR and PolyServe Partner for Utility Computing Offerings

Oracle, SQL Server and Scalable File Serving on 3PAR and PolyServe
This is just a quick bit about the joining of forces in storage management. In this article about 3PAR and PolyServe, I see a very important quote:

“Homescape relies on 3PAR and PolyServe for mission-critical database and file serving to support the complete set of robust local home listings we provide to consumers,” stated Nancy Pejril, Director of Technical Operations and Quality Assurance for Homescape at Classified Ventures — whose divisions include cars.com, apartments.com, Homescape and HomeGain.


What Does This Have To Do With ASM?
Since this is an Oracle blog, I’ll point out that the customer quoted is Classified Ventures who are a very stable, happy Oracle RAC customer and have been since the early days of Oracle9i RAC. And to think, they don’t get to deal with bugs like this or or this. They have been running RAC in the PolyServe Database Utility for Oracle RAC for years.

Thin Provisioning for Oracle?
I have to admit that I have not had a great deal of time with 3PAR’s Thin Provisioning. The paper referenced in that URL goes on an on about allocating space to ASM only on demand. My knowledge of ASM leads me to believe that would either not work at all or not well, but like I said, I haven’t given Thin Provisioning a whirl. Oracle files are not sparse, so I must be missing something. No matter though, the combination of 3PAR and PolyServe supports an Oracle deployment in the more reasonable, traditional filesystem approach. Pretty much all other data in the world is stored in filesystems and since Oracle has done OK with them for 30 years, maybe Oracle shops aren’t clamoring for an unnecessary change. Or better yet, maybe there is so much non-Oracle data out there alongside Oracle that a one-off style of disk management isn’t going to fit in all that well.

Low-Level Disk Allocation Support!
One thing about 3PAR that I see mentioned in that paper—and I’ve had confirmation from the field on this—is that 3PAR arrays support the ability to choose the actual regions of the disks to comprise a LUN. Now that I like! You’ll often hear us cronies from the OakTable pushing the concept of allocating storage for IOPS as opposed to capacity. Further, we talk of preferring the outer, say, 50-60% of a platter for primary Oracle usage and the remainder for non-transactional operations like disk-to-disk backup and so on. That paper reads:

For example, administrators can use the powerful, yet simple-to-use provisioning rules to specify whether the inner or outer regions of a disk drive should be used for data placement. Once selected, the rules are applied automatically during volume provisioning. IT organizations with performance sensitive databases can utilize this unique flexibility of the 3PAR InServ platform to place database files and log files on higher-performance outer regions while the archive logs and backup files can be placed on lower-performance inner regions

MySQL Databases in Excess of 4GB!

Enterprise Open Source Magazine reported that MySQL is now capable of managing a 4GB database! But that is not all, it seems the deployment mentioned in the article can even scale to 14GB! Regarding MySQL, the article states:

“We provide customers with fault-tolerant availability of 99.999 percent”, says Mike Wiedemann, MySQL AB’s country sales director for Central Europe. He also explains the details of the Toto-Lotto’s MySQL Cluster implementation: The software is run within a traditional architecture on the presentation, application and persistence level on two SQL and four NDB nodes in a Linux environment. Although the database currently holds 4 GB, the system is designed to comfortably scale to 14 GB and 1.600 queries per second.

And:

According to Lotto Niedersachsen, their main reasons for the future expansion of its MySQL use are: High speed, Easy scalability, Availability of high-quality professional support, Excellent price/performance ratio.

It is not clear whether this MySQL deployment is back-ended with InnoDB or not. If not, I wonder if that had anything to do with the fact that Oracle owns InnoDB now? No matter the reason, I think either the bar is set pretty low for MySQL, or the article reported the database size one or more orders of magnitude incorrectly!


DISCLAIMER

I work for Amazon Web Services. The opinions I share in this blog are my own. I'm *not* communicating as a spokesperson for Amazon. In other words, I work at Amazon, but this is my own opinion.

Enter your email address to follow this blog and receive notifications of new posts by email.

Join 741 other subscribers
Oracle ACE Program Status

Click It

website metrics

Fond Memories

Copyright

All content is © Kevin Closson and "Kevin Closson's Blog: Platforms, Databases, and Storage", 2006-2015. Unauthorized use and/or duplication of this material without express and written permission from this blog’s author and/or owner is strictly prohibited. Excerpts and links may be used, provided that full and clear credit is given to Kevin Closson and Kevin Closson's Blog: Platforms, Databases, and Storage with appropriate and specific direction to the original content.