On March 26, 2013, Oracle announced a server refresh based on the new SPARC T5 processor[1]. The press release proclaims SPARC T5 is the “World’s Fastest Microprocessor”—an assertion backed up with a list of several recent benchmark results included a published TPC-C result.
This article focuses on the recent SPARC T5 TPC-C result–a single-system world record that demonstrated extreme throughput. The SPARC T5 result bested the prior non-clustered Oracle Database result by 69%! To be fair, that was 69% better than a server based an Intel Xeon E7 processor slated to be obsolete this year (with the release of Ivy Bridge-EX). Nonetheless, throughput is throughput and throughput is all that matters, isn’t it?
What Costs Is What Matters
There are several ways to license Oracle Database. Putting aside low-end user-count license models and database editions other than Enterprise Edition leaves the most common license model which is based on per-processor licensing.
To layman, and seasoned veteran alike, mastering Oracle licensing is a difficult task. In fact, Oracle goes so far as to publish a Software Investment Guide[2] that spells out the necessity for licensees to identify personnel within their organization responsible for coping with license compliance. Nonetheless, there are some simple licensing principles that play a significant role in understanding the relevance of any microprocessor being anointed the “fastest in the world.”
One would naturally presume “fastest” connotes cost savings when dealing with microprocessors. Deploying faster processors usually should mean fewer are needed thus yielding cost savings spanning datacenter physical and environmental savings as well as reduced per-processor licensing. Should, that is.
What is a Processor?
Oracle’s Software Investment Guide covers the various licensing models available to customers. Under the heading “Processor Metric” Oracle offers several situations where licensing by the processor is beneficial. The guide goes on to state:
The number of required licenses shall be determined by multiplying the total number of cores of the processor by a core processor licensing factor specified on the Oracle Processor Core Factor Table
As this quoted information suggests, the matter isn’t as simple as counting the number of processor “sockets” in a server. Oracle understands that more powerful processors allow their customers to achieve more throughput per core. So, Oracle could stand to lose a lot of revenue if per-core software licensing did not factor in the different performance characteristics of modern processors. In short, Oracle is compelled to charge more for faster processors.
As the Software Investment Guide states, one must consult the Oracle Processor Core Factor Table[3] in order to determine list price for a specific processor. The Oracle Processor Core Factor Table has a two-columns—one for the processor make and model and the other for the Licensing Factor. Multiplying the Licensing Factor times the number of processor cores produces list price for Oracle software.
The Oracle Processor Core Factor Table is occasionally updated to reflect new processors that come into the marketplace. For example, the table was updated on October 2, 2010, September 6, 2011 and again on March 26, 2013 to correspond with the availability of Oracle’s T3, T4 and T5 processor respectively. As per the table, the T3 processor was assigned a Licensing Factor of .25 whereas the T4 and T5 are recognized as being more powerful and thus assigned a .5 factor. This means, of course, that any customer who migrated from T3 to T4 had to ante-up for higher-cost software—unless, of course, the T4 allowed the customer to reduce the number of cores in the deployment by 50%.
The World’s Fastest Microprocessor
According to dictionary definition, something that is deemed fast is a) characterized by quick motion, b) moving rapidly and/or c) taking a comparatively short time. None of these definitions imply throughput as we know it in the computer science world. In information processing, fast is all about latency whether service times for transactions or underlying processing associated with transactions such as memory latency.
The TPC-C specification stipulates that transaction response times are to be audited along with throughput. The most important transaction is, of course, New Order. That said, the response time of transactions on a multi-processing computer have little bearing on transaction throughput. This fact is clearly evident in published TPC-C results as will be revealed later in this article.
Figure 1 shows the New Order 90th-percentile response times for the three most recently published Oracle Database 11g TPC-C results[4]. Included in the chart is a depiction of Oracle’s SPARC T5 demonstrating an admirable 13% improvement in New Order response times compared to current[5] Intel two-socket Xeon server technology. That is somewhat fast. On the contrary, however, one year—to the day—before Oracle published the SPARC T5 result, Intel’s Xeon E7 processors exhibited 46% faster New Order response times than the SPARC T5. Now that, is fast.
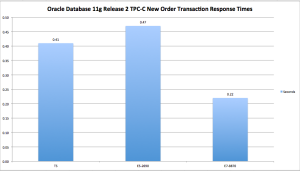
Figure 1: Comparing Oracle Database TPC-C Transaction Response Times. Various Platforms. Smaller is better.
Cost Is Still All That Matters
According to the Oracle Technology Global Price List dated March 15, 2013[6], Oracle Database Enterprise Edition with Real Application Clusters and Partitioning has a list price of USD $82,000 “per processor.” As explained above in this article, one must apply the processor core factor to get to the real list price for a given platform. It so happens that all three of the processors spoken of in Figure 1 have been assessed a core factor of .5 by Oracle. While all three of these processors are on par in the core factor category, they have have vastly different numbers of cores per socket. Moreover, the servers used in these three benchmarks had socket-counts ranging from 2 to 8. To that end, the SPARC T5 server had 128 cores, the Intel Xeon E7-8870 server had 80 cores and the Intel Xeon E5-2690 server had 16 cores.
Performance Per Oracle License
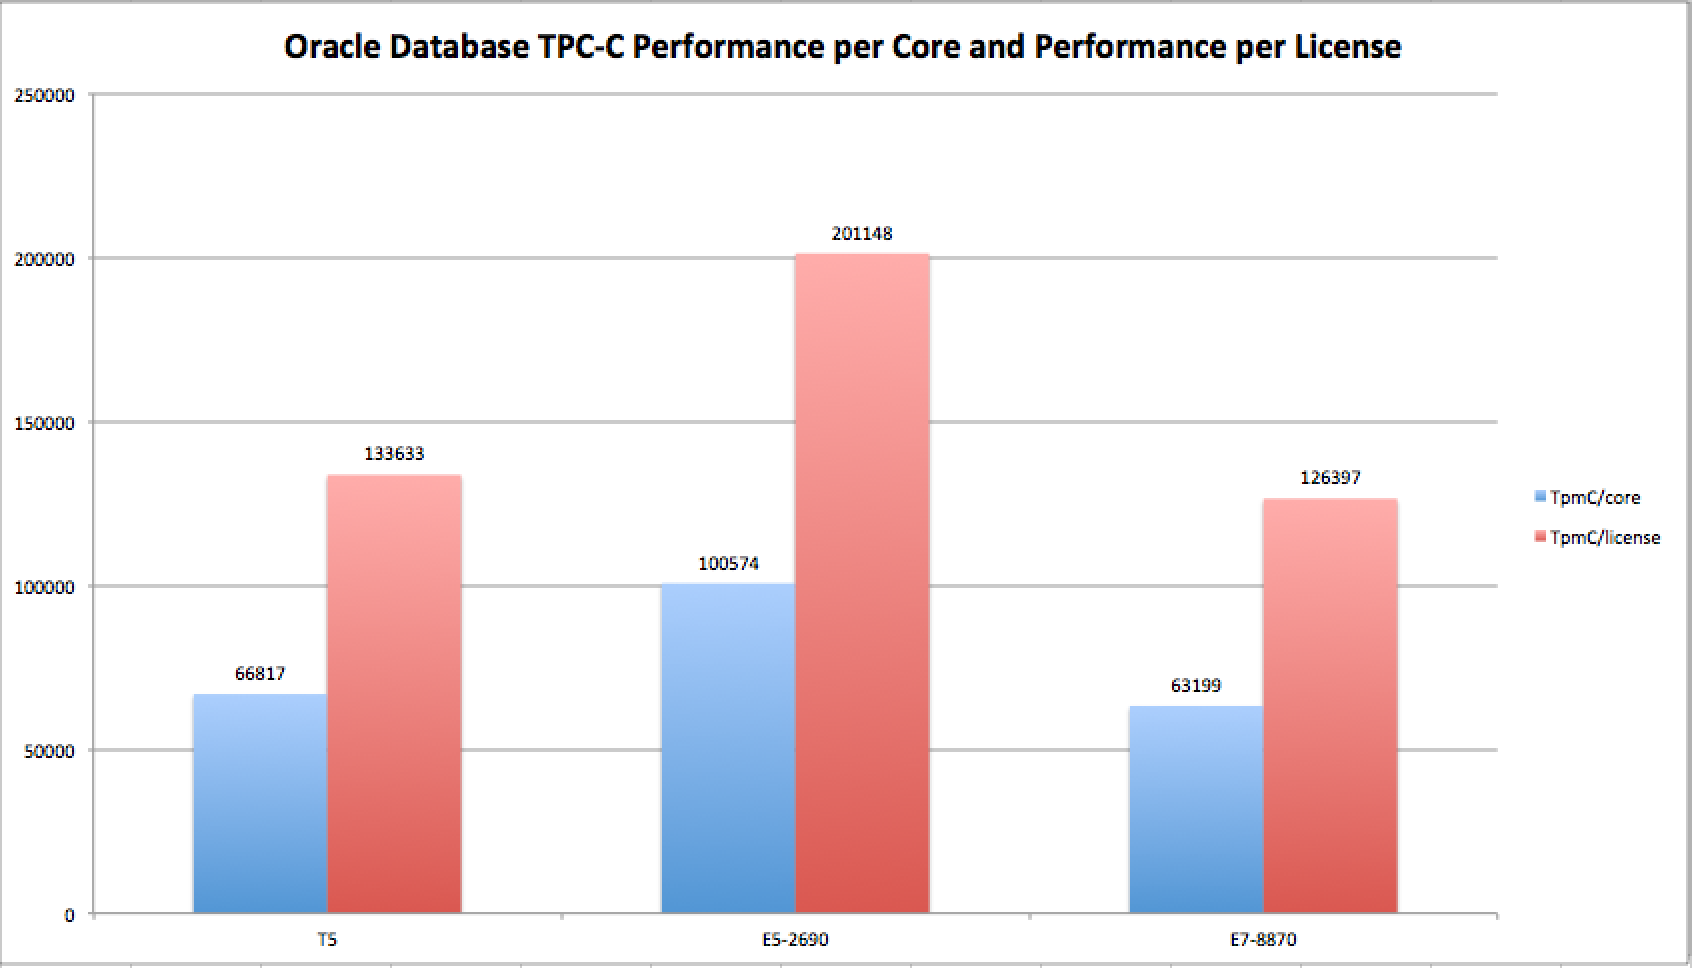
Given the core counts, license factor and throughput achieved for the three TPC-C benchmarks discussed in the previous section of this article, one can easily calculate the all-important performance-per-license attributes of each of the servers. Figure 2 presents TPC-C throughput per core and per Oracle license in a side-by-side visualization for the three recent TPC-C results.
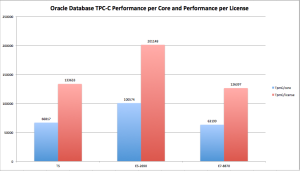
Figure 2: Comparing Oracle Database TPC-C Performance per-core and per-license. Bigger is better.
The Importance of Response Times
In order to appreciate the rightful importance of response time in characterizing platform performance, consider the information presented in Figure 3. Figure 3 divides response time into TPC-C performance per core. Since the core factor is the same for each of these processors this is essentially weighing response time against license cost.
To add some historical perspective, Figure 3 also includes an Oracle Database 11g published TPC-C result[7] from June 2008 using Intel’s Xeon 5400 family of processors which produced 20,271 TpmC/core and .2 seconds New Order response times. It is important to point out that the core factor has always been .5 for Xeon processors. As Figure 3 shows, SPARC T5 outperforms the 2008-era result by about 35%. On the other hand, the Intel two-socket Xeon E5 result delivers 31% better results in this type of performance assessment. Finally, the Intel 8-socket Xeon E7 result outperformed SPARC T5 by 76%. If customers care about both response time and cost these are important data points.
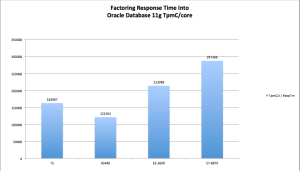
Figure 3: Performance Per Core weighted by Transaction Response Times. Bigger Is Better.
Parting Thoughts
I accept the fact that there are many reasons for Oracle customers to remain on SPARC/Solaris—the most significant being postponing the effort of migrating to Intel-based servers. I would argue, however, that such a decision amounts to postponing the inevitable. That is my opinion, true, but countless Oracle shops made that move during the decade-long decline of Sun Microsystems market share. In fact, Oracle strongly marketed Intel servers running Real Application Clusters attached to conventional storage (mostly sourced from EMC) as a viable alternative to Oracle on Solaris.
I don’t speak lightly of the difficulty in moving off of SPARC/Solaris. In fact, I am very sympathetic of the difficulty such a task entails. What I can’t detail, in this blog entry, is a comparison between re-platforming from dilapidated SPARC servers and storage to something 21st-century—such as a converged infrastructure platform like VCE. It all seems like a pay-now or pay-later situation to me. Maybe readers with a 5-year vision for their datacenter can detail for us why one would want to gamble on the SPARC roadmap.
[5] As of the production date of this article, 2013 is the release target for the Ivy Bridge-EP 22nm die shrink next-generation improvement in Intel’s Xeon E5 family


Recent Comments