Archive Page 4

Yes, You Must Use CALIBRATE_IO. No, You Mustn’t Use It To Test Storage Performance.

I occasionally get questions from customers and colleagues about performance expectations for the Oracle Database procedure called calibrate_io on XtremIO storage. This procedure must be executed in order to update the data dictionary. I assert, however, that it shouldn’t be used to measure platform suitability for Oracle Database physical I/O. The main reason I say this is because calibrate_io is a black box, as it were.

The procedure is, indeed, documented so it can’t possibly be a “black box”, right? Well, consider the fact that the following eight words are the technical detail provided in the Oracle documentation regarding what calibrate_io does:

This procedure calibrates the I/O capabilities of storage.

OK, I admit it. I’m being too harsh. There is also this section of the Oracle documentation that says a few more words about what this procedure does but not enough to make it useful as a platform suitability testing tool.

A Necessary Evil?

Yes, you must run calibrate_io. The measurements gleaned by calibrate_io are used by the query processing runtime (specifically involving Auto DOP functionality). The way I think of it is similar to how I think of gathering statistics for CBO. Gathering statistics generates I/O but I don’t care about the I/O it generates. I only care that CBO might have half a chance of generating a reasonable query plan given a complex SQL statement, schema and the nature of the data contained in the tables. So yes, calibrate_io generates I/O—and this, like I/O generated when gathering statistics, is I/O I do not care about. But why?

Here are some facts about the I/O generated by calibrate_io:

  • The I/O is 100% read
  • The reads are asynchronous
  • The reads are buffered in the process heap (not shared buffers in the SGA)
  • The code doesn’t even peek into the contents of the blocks being read!
  • There is limited control over what tablespaces are accessed for the I/O
  • The results are not predictable
  • The results are not repeatable

My Criticisms

Having provided the above list of calibrate_io characteristics, I feel compelled to elaborate.

About Asynchronous I/O

My main issue with calibrate_io is it performs single-block random reads with asynchronous I/O calls buffered in the process heap. This type of I/O has nothing in common with the main reason random single-block I/O is performed by Oracle Database. The vast majority of single-block random I/O is known as db file sequential read—which is buffered in the SGA and is synchronous I/O. The wait event is called db file sequential read because each synchronous call to the operating system is made sequentially, one after the other by foreground processes. But there is more to SGA-buffered reads than just I/O.

About Server Metadata and Mutual Exclusion

Wrapped up in SGA-buffered I/O is all the necessary overhead of shared-cache management. Oracle can’t just plop a block of data from disk in the SGA and expect that other processes will be able to locate it later. When a process is reading a block into the SGA buffer cache it has to navigate spinlocks for the protected cache contents metadata known as cache buffers chains. Cache buffers chains tracks what blocks are in the buffer cache by their on-disk address.  Buffer caches, like that in the SGA, also need to track the age of buffers. Oracle processes can’t just use any shared buffer. Oracle maintains buffer age in metadata known as cache buffers lru—which is also spinlock-protected metadata.

All of this talk about server metadata means that as the rate of SGA buffer cache block replacement increases—with newly-read blocks from storage—there is also increased pressure on these spinlocks. In other words, faster storage means more pressure on CPU. Scaling spinlocks is a huge CPU problem. It always has been—and even more so on NUMA systems. Testing I/O performance without also involving these critical CPU-intensive code paths provides false comfort when trying to determine platform suitability for Oracle Database.

Since applications to not drive random single-block asynchronous reads in Oracle Database, why measure it? I say don’t! Yes, execute calibrate_io, for reasons related to Auto DOP functionality, but not for a relevant reading of storage subsystem performance.

About User Data

This is one that surprises me quite frequently. It astounds me how quick some folks are to dismiss the importance of test tools that access user data. Say what?  Yes, I routinely point out that neither calibrate_io nor Orion access the data that is being read from storage. All Orion and calibrate_io do is perform the I/O and let the data in the buffer remain untouched.  It always seems strange to me when folks dismiss the relevance of this fact. Is it not database technology we are talking about here? Databases store your data. When you test platform suitability for Oracle Database I hold fast that it is best to 1) use Oracle Database (thus an actual SQL-driven toolkit as opposed to an external kit like Orion or fio or vdbench or any other such tool) and 2) that the test kit access rows of data in the blocks! I’m just that way.

Of course SLOB (and other SQL-driven test kits such as Swingbench do indeed access rows of data). Swingbench handily tests Oracle Database transaction capabilities and SLOB uses SQL to perform maximum I/O per host CPU cycle. Different test kits for different testing.

A Look At Some Testing Results

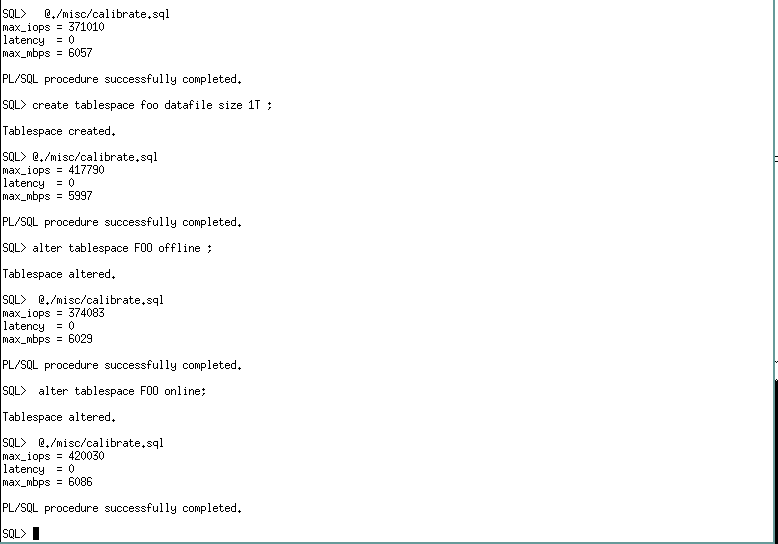
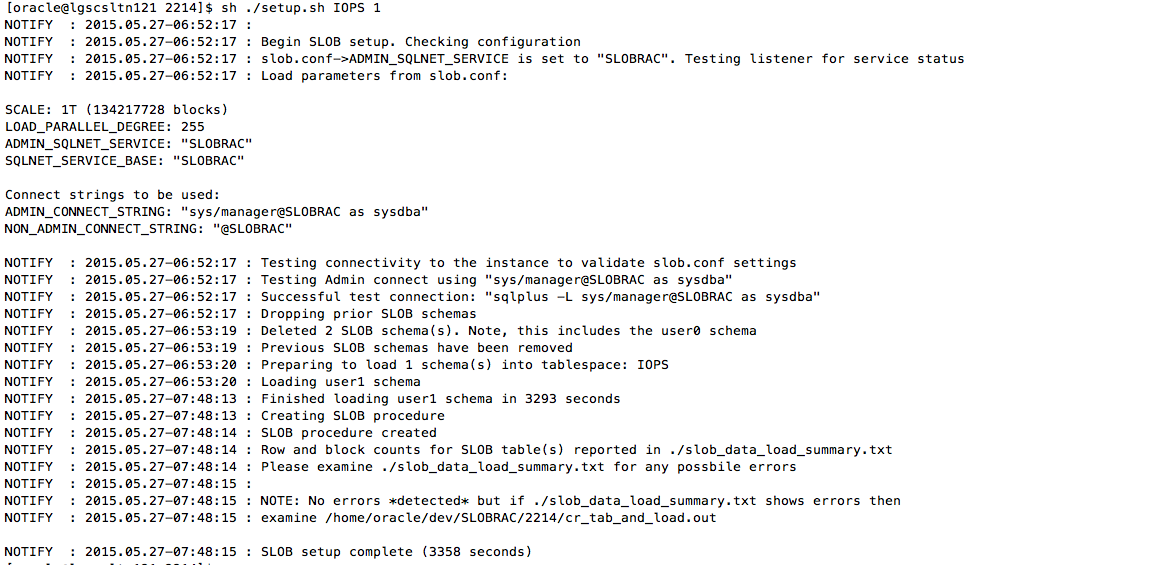
The first thing about calibrate_io I’ll discuss in this section is how the user is given no control or insight into what data segments are being accessed. Consider the following screenshot which shows:

  1. Use of the calibrate.sql script found under the misc directory in the SLOB kit (SLOB/misc/calibrate.sql) to achieve 371,010 peak IOPS and zero latency. This particular test was executed with a Linux host attached to an XtremIO array. Um, no, the actual latencies are not zero.
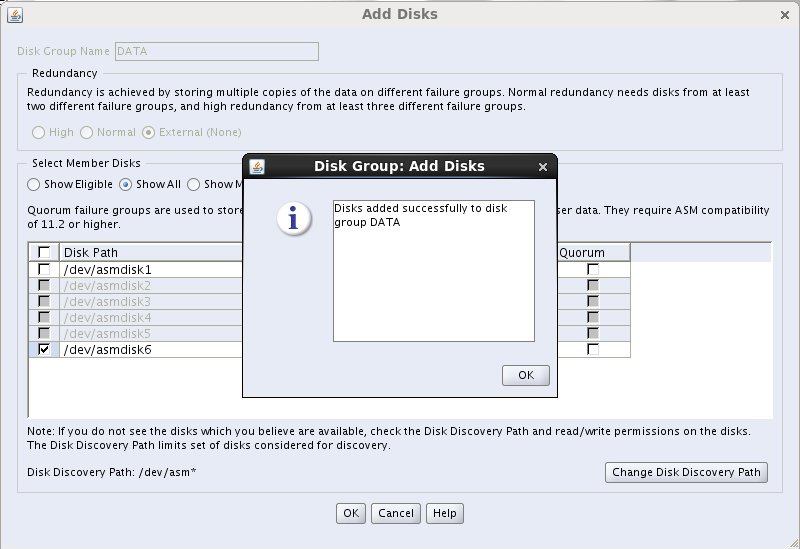
  2. I then created a 1TB tablespace. What is not seen in the screenshot is that all the tablespaces in this database are stored in an ASM disk group consisting of 4 XtremIO volumes. So the tablespace called FOO resides in the same ASM disk group. The ASM disk group uses external redundancy.
  3. After adding a 1TB tablespace to the database I once again executed calibrate_io and found that the IOPS increased 13% and latencies remained at zero. Um, no, the actual latencies are not zero!
  4. I then offlined the tablespace called FOO and executed calibrate_io to find that that IOPS fell back to within 1% of the first sample.
  5. Finally, I onlined the tablespace called FOO and the IOPS came back to within 1% of the original sample that included the FOO tablespace.
A Black Box

My objections to this result is calibrate_io is a black box. I’m left with no way to understand why adding a 1TB tablespace improved IOPS. After all, the tablespace was created in the same ASM disk group consisting of block devices provisioned from an all-flash array (XtremIO). There is simply no storage-related reason for the test result to improve as it did.

calibrate_after_file_add

More IOPS, More Questions. I Prefer Answers.

I decided to spend some time taking a closer look at calibrate_io but since I wanted more performance capability I moved my testing to an XtremIO array with 4 X-Bricks and used a 2-Socket Xeon E5-2699v3 (HSW-EP 2s36c72t) server to drive the I/O.

The following screenshot shows the result of calibrate_io. This test configuration yielded 572,145 IOPS and, again, zero latency. Um, no, the real latency is not zero. The latencies are sub-millisecond though. The screen shot also shows the commands in the SLOB/misc/calibrate.sql file. The first two arguments to DBMS_RESOURCE_MANAGER.CALIBRATE_IO are “in” parameters. The value seen for parameter 2 is not the default. The next section of this blog post shows a variety of testing with varying values assigned to these parameters.

calibrate_572K-iops

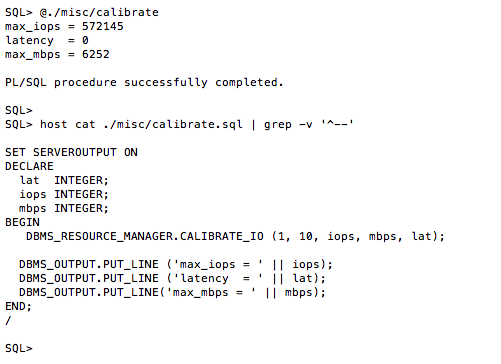
As per the documentation, the first parameter to calibrate_io is “approximate number of physical disks” being tested and the second parameter is “the maximum tolerable latency in milliseconds” for the single-block I/O.

table-of-calibrate_io_tests

As the table above shows I varied the “approximate number of physical disks” from 1 to 10,000 and the “maximum tolerable latency” from 10 to 20 and then 100. For each test I measured the elapsed time.

The results show us that the test requires twice the elapsed time with 1 approximate physical disk as it does for with 10,000 approximate physical disks. This is a nonsensical result but without any documentation on what calibrate_io actually does we are simply left scratching our heads. Another oddity is that with 10,000 approximate disks the throughput in megabytes per second is reduced by nearly 40% and that is without regard for the “tolerable latency” value. This is clearly a self-imposed limited within calibrate_io but why is the big question.

I’ll leave you, the reader, to draw your own conclusions about the data in the table. However, I use the set of results with “tolerable latency” set to 20 as validation for one of my indictments above. I stated calibrate_io is not predictable. Simply look at the set of results in the 20 “latency” parameter case and you too will conclude calibrate_io is not predictable.

So How Does CALIBRATE_IO Compare To SLOB?

I get this question quite frequently. Jokingly I say it compares in much the same way a chicken compares to a snake. They both lay eggs. Well, I should say they both perform I/O.

I wrote a few words above about how calibrate_io uses asynchronous I/O calls to test single-block random reads. I also have pointed out that SLOB performs the more correct synchronous single block reads. There is, however, an advanced testing technique many SLOB users employ to test PGA reads with SLOB as opposed to the typical SLOB reads into the SGA. What’s the difference? Well, revisit the section above where I discuss the server metadata management overhead related to reading blocks into the SGA. If you tweak SLOB to perform full scans you will test the flow of data through the PGA and thus the effect of eliminating all the shared-cache overhead. The difference is dramatic because, after all, “everything is a CPU problem.”

In a subsequent blog post I’ll give more details on how to configure SLOB for direct path with single-block reads!

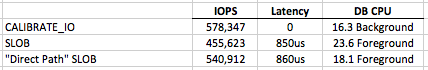
To close out this blog entry I will show a table of test results comparing some key time model data. I collected AWR reports when calibrate_io was running as well as SLOB with direct path reads and then again with the default SLOB with SGA reads. Notice how the direct path SLOB increased IOPS by 19% just because blocks flowed through the PGA as opposed to the SGA. Remember, both of the SLOB results are 100% single-block reads. The only difference is the cache management overhead is removed. This is clearly seen by the difference in DB CPU. When performing the lightweight PGA reads the host was able to drive 29,884 IOPS per DB CPU but the proper SLOB results (SGA buffered) shows the host could only drive 19,306 IOPS per DB CPU. Remember DB CPU represents processor threads utilization on a threaded-processor. These results are from a 2s36c72t (HSW-EP) so these figures could also be stated as per DB CPU or per CPU thread.

If you are testing platforms suitability for Oracle it’s best to not use a test kit that is artificially lightweight. Your OLTP/ERP application uses the SGA, so test that!

The table also shows that calibrate_io achieved the highest IOPS but I don’t care one bit about that–because it isn’t true database I/O.

tale-of-the-calibrate-versus-slob-tape

AWR Reports

I’d like to offer the following links to the full AWR reports summarized in the above table:

Additional Reading

Summary

Use calibrate_io. Just don’t use it to test platform suitability for Oracle Database.

Is SLOB AWR Generation Really, Really, Really Slow on Oracle Database 11.2.0.4? Yes, Unless…

If you are testing SLOB against 11.2.0.4 and find that the AWR report generation phase of runit.sh is taking an inordinate amount of time (e.g., more than 10 seconds) then please be aware that, in the SLOB/awr subdirectory, there is a remedy script rightly called 11204-awr-stall-fix.sql.

Simply execute this script when connected to the instance with sysdba privilege and the problem will be solved. 

11.2.0.4-awr-stall-fix.sql


Performance Data Visualization for SLOB. The SLOB Expert Community is Vibrant!

Thanks to Nikolay Savvinov (@oradiag) for his excellent post on how to wrap his scripts around the SLOB test driver (runit.sh) to capture and produce performance data visualization graphs.  I recommend a visit to his post here:

Performance Data Visualization with SLOB


As always, the link for SLOB is: Obtain the SLOB Kit and Helpful Information Here

Little Things Doth Crabby Make – Part XVIV: Enterprise Manager 12c Cloud Control 12.1.0.5 Install Problem.

This is a short post to help out any possible “googlers” looking for an answer to why their 12.1.0.5 EM Cloud Control install is failing in the make phase with ins_calypso.mk.

Note, this EM install was taking place on an Oracle Linux 7.1 host.

The following snippet shows the text that was displayed in the dialogue box when the error was hit:


INFO: 11/12/15 12:10:37 PM PST: ----------------------------------
INFO: 11/12/15 12:10:37 PM PST: Exception thrown from action: make
Exception Name: MakefileException
Exception String: Error in invoking target 'install' of makefile '/home/oracle/app/oracle/oms12cr5/Oracle_WT/webcache/lib/ins_calypso.mk'. See '/home/oracle/oraInventory/logs/cloneActions2015-11-12_12-10-18-PM.log' for details.
Exception Severity: 1
INFO: 11/12/15 12:10:37 PM PST: POPUP WARNING:Error in invoking target 'install' of makefile '/home/oracle/app/oracle/oms12cr5/Oracle_WT/webcache/lib/ins_calypso.mk'. See '/home/oracle/oraInventory/logs/cloneActions2015-11-12_12-10-18-PM.log' for details.

Click "Retry" to try again.
Click "Ignore" to ignore this error and go on.
Click "Cancel" to stop this installation.
INFO: 11/12/15 12:20:14 PM PST: The output of this make operation is also available at: '/home/oracle/app/oracle/oms12cr5/Oracle_WT/install/make.log'

The following shows the simple fix:


$
$ diff ./app/oracle/oms12cr5/Oracle_WT/lib/sysliblist.orig ./app/oracle/oms12cr5/Oracle_WT/lib/sysliblist
1c1
< -ldl -lm -lpthread -lnsl -lirc -lipgo --- > -ldl -lm -lpthread -lnsl -lirc -lipgo -ldms2
$
$

So if this error hath made at least one googler less crabby I’ll consider this installment in the Little Things Doth Crabby Make series all worth it.

Oracle OpenWorld 2015. Additional Attractions to Consider: OakTable World and EMC Rocks Oracle OpenWorld.

This is a quick blog entry to to share some information with readers who are attending Oracle OpenWorld 2015.

EMC Rocks Oracle OpenWorld

EMC has a concurrent event at the Elan Event Center (directly across the street from Moscone West) during OpenWorld. This event is a great opportunity to come see the most unique and powerful solutions and products EMC has to offer to folks using Oracle Database. You can register for the event at the following link or just show up with your OpenWorld badge. Link to register for EMC Rocks Oracle OpenWorld. Please visit the link to get more information about the event. I hope to see you there.


Oaktable World 2015

Folks who are aware of the Oaktable Network organization will be pleased to hear that Oaktable World is once again being held concurrently with Oracle OpenWorld. Please visit the following link to get more information about Oaktable Word. You’ll find that no registration is necessary and the speaker list is quite attractive. Link to information about Oaktable World 2015

Shameless Plug

Well, it is my blog after all!  I’ll be delivering another installment of my Modern Platform Topics for Modern DBAs track. This session will show how to use SLOB to study how CPU-intensive your Oracle OLTP-related *waits* are. I’ll also be showing CPU costs associated with key DW/BI/Analytics processing “underpinnings” like scan, filtration and projection on modern 2-socket servers running Linux and Oracle Database 12c. Please join us on Monday October 26 at 3PM as per the Oaktable World schedule (see below or follow the links).


Here is a screenshot of the EMC Rocks Oracle OpenWorld:

Screen Shot 2015-10-21 at 5.02.28 PM

The following is the schedule for technical sessions at EMC Rocks Oracle OpenWorld. I’ve highlighted the XtremIO related sessions since that is the business unit of EMC I work in.

Screen Shot 2015-10-21 at 5.24.24 PM


The following is the Oaktable World schedule:

Screen Shot 2015-10-21 at 4.59.00 PM

Screen Shot 2015-10-21 at 5.28.02 PM


Copy Data Management for Oracle Database with EMC AppSync and XtremIO

This is a quick blog entry to invite readers to view this little demonstration video I created. The topic is Copy Data Management in an Oracle Database environment. We all know the pains involved with the number of database copies needed in today’s Oracle environment. Well, how about technology with these characteristics:

  1. 100% space efficient. There is no need for any full-copy “donor” in this solution. You can create 8192 XtremIO Virtual Copies of volumes in an XtremIO array and there is no reduction in user-capacity at the storage level. For example, 512 copies of a 1TB volume with Oracle tablespaces in it takes exactly 1TB from the array.
  2. Self service. With EMC AppSync permissions can be set up so that developers can create their own copies, refresh their own copies and expire their own copies.
  3. Speed. AppSync copy operations such as creation and refresh are measured in seconds.
  4. Data Services. All XtremIO Virtual Copies enjoy data reduction services. So as users begin to make changes to their database copies the modified blocks are first treated with de-duplication and then compression.

You more than likely need XtremIO in any cose. However, now it’s also time to think about the ease of provisioning copies of Oracle databases to test/dev and other functions the XtremIO way.

It only takes minutes so please give this a view:

Focusing on Ext4 and XFS TRIM Operations

I’ve been doing some testing that requires rather large file systems. I have an EMC XtremIO Dual X-Brick array from which I provision a 10 terabyte volume. Volumes in XtremIO are always thinly provisioned. The testing I’m doing required me to scrutinize default Linux mkfs(8) behavior for both Ext4 and XFS. This is part 1 in a short series and it is about Ext4.

Discard the Discard Option

The first thing I noticed in this testing was the fantastical “throughput” demonstrated at the array while running the mkfs(8) command with the “-t ext4” option/arg pair. As the following screen shot shows the “throughput” at the array level was just shy of 72GB/s.

That’s not real I/O…I’ll explain…

EMC XtremIO Dual X-Brick Array During Ext4 mkfs(8). Default Options.

EMC XtremIO Dual X-Brick Array During Ext4 mkfs(8). Default Options.

The default options for Ext4 include the discard (TRIM under the covers) option. The mkfs(8) manpage has this to say about the discard option :

Attempt to discard blocks at mkfs time (discarding blocks initially is useful on solid state devices and sparse / thin-provisioned storage). When the device advertises that discard also zeroes data (any subsequent read after the discard and before write returns zero), then mark all not-yet-zeroed inode tables as zeroed. This significantly speeds up filesystem initialization. This is set as default.

I’ve read that quoted text at least eleventeen times but the wording still sounds like gibberish-scented gobbledygook to me–well, except for the bit about significantly speeding up filesystem initialization.

Since XtremIO volumes are created thin I don’t see any reason for mkfs to take action to make it, what, thinner?  Please let me share test results challenging the assertion that the discard mkfs option results in faster file system initialization. This is the default functionality after all.

In the following terminal output you’ll see that the default mkfs options take 152 seconds to make a file system on a freshly-created 10TB XtremIO volume:


# time mkfs -t ext4 /dev/xtremio/fs/test
mke2fs 1.43-WIP (20-Jun-2013)
Discarding device blocks: done
Filesystem label=
OS type: Linux
Block size=4096 (log=2)
Fragment size=4096 (log=2)
Stride=2 blocks, Stripe width=16 blocks
335544320 inodes, 2684354560 blocks
134217728 blocks (5.00%) reserved for the super user
First data block=0
Maximum filesystem blocks=4294967296
81920 block groups
32768 blocks per group, 32768 fragments per group
4096 inodes per group
Superblock backups stored on blocks:
32768, 98304, 163840, 229376, 294912, 819200, 884736, 1605632, 2654208,
4096000, 7962624, 11239424, 20480000, 23887872, 71663616, 78675968,
102400000, 214990848, 512000000, 550731776, 644972544, 1934917632,
2560000000

Allocating group tables: done
Writing inode tables: done
Creating journal (32768 blocks): done
Writing superblocks and filesystem accounting information: done
real 2m32.055s
user 0m3.648s
sys 0m17.280s
#

The mkfs(8) Command Without Default Discard Functionality

Please bear in mind that default 152 second result is not due to languishing on pathetic physical I/O. The storage is fast. Please consider the following terminal output where I passed in the non-default -E option with the nodiscard argument. The file system creation took 4.8 seconds:

# time mkfs -t ext4 -E nodiscard /dev/xtremio/fs/test
mke2fs 1.43-WIP (20-Jun-2013)
Filesystem label=
OS type: Linux
Block size=4096 (log=2)
Fragment size=4096 (log=2)
Stride=2 blocks, Stripe width=16 blocks
335544320 inodes, 2684354560 blocks
134217728 blocks (5.00%) reserved for the super user
First data block=0
Maximum filesystem blocks=4294967296
81920 block groups
32768 blocks per group, 32768 fragments per group
4096 inodes per group
Superblock backups stored on blocks:
 32768, 98304, 163840, 229376, 294912, 819200, 884736, 1605632, 2654208,
 4096000, 7962624, 11239424, 20480000, 23887872, 71663616, 78675968,
 102400000, 214990848, 512000000, 550731776, 644972544, 1934917632,
 2560000000

Allocating group tables: done
Writing inode tables: done
Creating journal (32768 blocks): done
Writing superblocks and filesystem accounting information: done 

real 0m4.856s
user 0m4.264s
sys 0m0.415s
#

I think 152 seconds down to 4.8 makes the point that with proper, thinly-provisioned storage the mkfs discard option does not “significantly speed up filesystem initialization.” But initializing file systems is not something one does frequently so investigation into the discard mount(8) option was in order.

Taking Ext4 For A Drive

Since I had this 10TB Ext4 file system–and a fresh focus on file system discard (storage TRIM) features–I thought I’d take it for a drive.

Discarded the Default Discard But Added The Non-Default Discard

While the default mkfs(8) command includes discard, the mount(8) command does not. I decided to investigate this option while unlinking a reasonable number of large files. To do so I ran a simple script (shown below) that copies 64 files of 16 gigabytes each–in parallel–into the Ext4 file system. I then timed a single invocation of the rm(1) command to remove all 64 of these files. Unlinking file in a Linux file system is a metadata operation, however, when the discard option is used to mount the file system each unlink operation includes TRIM operations being sent to storage. The following screen shot of the XtremIO performance dashboard was taken while the rm(1) command was running. The discard mount option turns a metadata operation into a rather costly storage operation.

Array Level Activity During Bulk rm(1) Command Processing. Ext4 (discard mount option)

Array Level Activity During Bulk rm(1) Command Processing. Ext4 (discard mount option)

The following terminal output shows the test step sequence used to test the discard mount option:

# umount /mnt ; mkfs -t ext4 -E nodiscard /dev/xtremio/fs/test; mount -t ext4 -o discard /dev/xtremio/fs/test /mnt
mke2fs 1.43-WIP (20-Jun-2013)
Filesystem label=
OS type: Linux
Block size=4096 (log=2)
Fragment size=4096 (log=2)
Stride=2 blocks, Stripe width=16 blocks
335544320 inodes, 2684354560 blocks
134217728 blocks (5.00%) reserved for the super user
First data block=0
Maximum filesystem blocks=4294967296
81920 block groups
32768 blocks per group, 32768 fragments per group
4096 inodes per group
Superblock backups stored on blocks:
 32768, 98304, 163840, 229376, 294912, 819200, 884736, 1605632, 2654208,
 4096000, 7962624, 11239424, 20480000, 23887872, 71663616, 78675968,
 102400000, 214990848, 512000000, 550731776, 644972544, 1934917632,
 2560000000

Allocating group tables: done
Writing inode tables: done
Creating journal (32768 blocks): done
Writing superblocks and filesystem accounting information: done 

# cd mnt
# cat &gt; cpit
for i in {1..64}; do ( dd if=/data1/tape of=file$i bs=1M oflag=direct )& done
wait
# time sh ./cpit &gt; /dev/null 2&gt;&1 

real 5m31.530s
user 0m2.906s
sys 8m45.292s
# du -sh .
1018G .
# time rm -f file*

real 4m52.608s
user 0m0.000s
sys 0m0.497s
#

The following terminal output shows the same test repeated with the file system being mounted with the default (thus no discard) mount options:

# cd ..
# umount /mnt ; mkfs -t ext4 -E nodiscard /dev/xtremio/fs/test; mount -t ext4 /dev/xtremio/fs/test /mnt
mke2fs 1.43-WIP (20-Jun-2013)
Filesystem label=
OS type: Linux
Block size=4096 (log=2)
Fragment size=4096 (log=2)
Stride=2 blocks, Stripe width=16 blocks
335544320 inodes, 2684354560 blocks
134217728 blocks (5.00%) reserved for the super user
First data block=0
Maximum filesystem blocks=4294967296
81920 block groups
32768 blocks per group, 32768 fragments per group
4096 inodes per group
Superblock backups stored on blocks:
 32768, 98304, 163840, 229376, 294912, 819200, 884736, 1605632, 2654208,
 4096000, 7962624, 11239424, 20480000, 23887872, 71663616, 78675968,
 102400000, 214990848, 512000000, 550731776, 644972544, 1934917632,
 2560000000

Allocating group tables: done
Writing inode tables: done
Creating journal (32768 blocks): done
Writing superblocks and filesystem accounting information: done 

# cd mnt
# cat &gt; cpit
for i in {1..64}; do ( dd if=/data1/tape of=file$i bs=1M oflag=direct )& done
wait
#
# time sh ./cpit &gt; /dev/null 2&gt;&1 

real 5m31.526s
user 0m2.957s
sys 8m50.317s
# time rm -f file*

real 0m16.398s
user 0m0.001s
sys 0m0.750s
#

This testing shows that mounting an Ext4 file system with the discard mount option dramatically impacts file removal operations. The default mount options (thus no discard option) performed the rm(1) command in 16 seconds whereas the same test took 292 seconds when mounted with the discard mount option.

So how can one perform the important house-cleaning that comes with TRIM operations?

The fstrim(8) Command

Ext4 supports user-invoked, online TRIM operations on mounted file systems. I would advise people to forego the discard mount option and opt for occasionally running the fstrim(8) command. The following is an example of  how long it takes to execute fstrim on the same 10TB file system stored in an EMC XtremIO array. I think that foregoing the taxation of commands like rm(1) is a good thing–especially since running fstrim is allowed on mounted file systems and only takes roughly 11 minutes on a 10TB file system.

# time fstrim -v /mnt
/mnt: 10908310835200 bytes were trimmed

real 11m29.325s
user 0m0.000s
sys 2m31.370s
#

Summary

If you use thinly-provisioned storage and want file deletion in Ext4 to return space to the array you have a choice. You can choose to take serious performance hits when you create the file system (default mkfs(8) options) and when you delete files (optional discard mount(8) option) or you can occasionally execute the fstrim(8) command on a mounted file system.

Up Next

The next post in this series will focus on XFS.

Announcing “SLOB Recipes”

I’ve started updating the SLOB Resources page with links to “recipes” for certain SLOB testing. The first installment is the recipe for loading 8TB scale SLOB 2.3 Multiple Schema Model with a 2-Socket Linux host attached to EMC XtremIO. Recipes will include (at a minimum) the relevant SLOB program output (e.g., setup.sh or runit.sh), init.ora and slob.conf.

Please keep an eye on the SLOB Resources page for updates…and don’t miss the first installment. It’s quite interesting.

SLOB-recipes

This Is Not Glossy Marketing But You Still Won’t Believe Your Eyes. EMC XtremIO 4.0 Snapshot Refresh For Agile Test / Dev Storage Provisioning in Oracle Database Environments.

This is just a quick blog post to direct readers to a YouTube video I recently created to help explain to someone how flexible EMC XtremIO Snapshots are. The power of this array capability is probably most appreciated in the realm of provisioning storage for Test and Development environments.

Although this is a silent motion picture I think it will speak volumes–or at least 1,000 words.

Please note: This is just a video demonstration to show the base mechanisms and how they relate to Oracle Database with Automatic Storage Management. This is not a scale demonstration. XtremIO snapshots are supported to in the thousands and extremely powerful “sibling trees” are fully supported.

Not Your Father’s Snapshot Technology

No storage array on the market is as flexible as XtremIO in the area of writable snapshots. This video demonstration shows how snapshots allow the administrator of a “DEV” host–using Oracle ASM–to quickly refresh to current or past versions of ASM disk group contents from the “PROD” environment.

The principles involved in this demonstration are:

  1. XtremIO snapshots are crash consistent.
  2. XtremIO snapshots are immediately created, writeable and space efficient. There is no fixed “donor” relationship. Snapshots can be created from other snapshots and refreshes can go in any direction.
  3. XtremIO snapshot refresh does not involve the host operating system. Snapshot and volume contents can be immediately “swapped” (refreshed) at the array level without any action on the host.

Regarding number 3 on that list, I’ll point out that while the operating system does not play a role in the snapshot operations per se, applications will be sensitive to contents of storage immediately changing. It is only for this reason that there are any host actions at all.

Are Host Operations Involved? Crash Consistent Does Not Mean Application-Coherent

The act of refreshing XtremIO snapshots does not change the SCSI WWN information so hosts do not have any way of knowing the contents of a LUN have changed. In the Oracle Database use case the following must be considered:

  1. With a file system based database one must unmount the file systems before refreshing a snapshot otherwise the file system will be corrupted. This should not alarm anyone. A snapshot refresh is an instantaneous content replacement at the array level. Operationally speaking, file system based databases only require database instance shutdown and the unmounting of the file system in preparation for application-coherent snapshot refresh.
  2. With an ASM based database one must dismount the ASM disk group in preparation for snapshot refresh. To that end, ASM database snapshot restore does not involve system administration in any way.

The video is 5 minutes long and it will show you the following happenings along a timeline:

  1. “PROD” and “DEV” database hosts (one physical and one virtual) each showing the same Oracle database (identical DBID) and database creation time as per dictionary views. This establishes the “donor”<->clone relationship. DEV is a snapshot of PROD. It is begat of a snapshot of a PROD consistency group
  2. A single-row token table called  “test” in the PROD database has value “1.” The DEV database does not even have the token table (DEV is independent of PROD…it’s been changing..but its origins are rooted in PROD as per point #1)
  3. At approximately 41 seconds into the video I take a snapshot of the PROD consistency group with “value 1” in the token table. This step prepares for “time travel” later in the demonstration
  4. I then update the PROD token table to contain the value “42”
  5. At ~2:02 into the video I have already dismounted DEV ASM disk groups and started clobbering DEV with the current state of PROD via a snapshot refresh. This is “catching up to PROD”
    1. Please note: No action at all was needed on the PROD side. The refresh of DEV from PROD is a logical, crash-consistent point in time image
  6. At ~2:53 into the video you’ll see that the DEV database instance has already been booted and that it has value “42” (step #4). This means DEV has “caught up to PROD”
  7. At ~3:32 you’ll see that I use dd(1) to copy the redo LUN over the data LUN on the DEV host to introduce ASM-level corruption
  8. At 3:57 the DEV database is shown as corrupted. In actuality, the ASM disk group holding the DEV database is corrupted
  9. In order to demonstrate traveling back in time, and to recover from the dd(1) corrupting of the ASM disk group,  you’ll see at 4:31 I chose to refresh from the snapshot I took at step #3
  10. At 5:11 you’ll see that DEV has healed from the dd(1) destruction of the ASM disk group, the database instance is booted, and the value in the token table is reverted to 1 (step #3) thus DEV has traveled back in time

Please note: In the YouTube box you can click to view full screen or on youtube.com if the video quality is a problem:

More Information

For information on the fundamentals of EMC XtremIO snapshot technology please refer to the following EMC paper: The fundamentals of XtremIO snapshot technology

For independent validation of XtremIO snapshot technology in a highly-virtualized environment with Oracle Database 12c please click on the following link: Principled Technologies, Inc Whitepaper

For a proven solution whitepaper showing massive scale data sharing with XtremIO snapshots please click on the following link: EMC Whitepaper on massive scale database consolidation via XtremIO

Announcing SLOB 2.3. Tarry Not, Get It While It’s Hot!

BLOG UPDATE 2015.07.16: SLOB 2.3.0.3-1 is now the current version.

This is just a quick post to announce SLOB 2.3. Please visit the SLOB Resources page to download the gzipped tar archive. The SLOB Resources page also has a link the SLOB 2.3 Documentation. SLOB Resources Page: Click Here. New in this release:

  1. The documentation is now also included in the tar archive under SLOB/doc in PDF form.
  2. SLOB 2.3 introduces the SLOB Single Schema feature. Please see the documentation.
  3. Because of SLOB Single Schema the kit now supports SLOB Threads. Note, however, SLOB Threads can be used in either Single or Multiple Schema Model.
  4. SLOB 2.3 has two types of “Hot Spots”
    1. In Multiple Schema Model there are both per-schema Hot Spots and a Hot Schema. Please see the SLOB 2.3 documentation for descriptions of these features.
  5. Improved error handling for both the SLOB Data Loader (setup.sh) and Test Execution program (runit.sh).
  6. Licensing. Prior releases of SLOB consisted of copyrighted programs with unclear licensing. Please don’t be alarmed. SLOB is still free to use. The LICENSE file defines the word “use.”

SLOB 2.3 User Guide

SLOB 2.3 is releasing within the next 48 hours. In case anyone wants to read about all the new features here is a link to the SLOB 2.3 User Guide:

SLOB 2.3 User Guide (pdf)


SLOB 2.3 Is Getting Close!

SLOB 2.3 is soon to be released. This version has a lot of new, important features but also a significant amount of tuning in the data loading kit. Before sharing where the progress is on that front, I’ll quickly list some of the new important features that will be in SLOB 2.3:

  1. Single Schema Support. SLOB historically avoids application-level contention by having database sessions perform the SLOB workload against a private schema. The idea behind SLOB is to exert maximum I/O pressure on storage while utilizing the minimum amount of host CPU possible. This lowers the barrier to entry for proper testing as one doesn’t require dozens of processors festering in transactional SQL code just to perform physical I/O. That said, there are cases where a single, large active data set is desirable–if not preferred. SLOB 2.3 allows one to load massive data sets quickly and run large numbers of SLOB threads (database sessions) to drive up the load on the system.
  2. Advanced Hot Spot Testing. SLOB 2.3 supports configuring each SLOB thread such that every Nth SQL statement operates on a hot spot sized in megabytes as specified in the slob.conf file. Moreover, this version of SLOB allows one to dictate the offset for the hot spot within the active data set. This allows one to easily move the hot spot from one test execution to the next. This sort of testing is crucial for platform experts studying hybrid storage arrays that identify and promote “hot” data into flash for example.
  3. Threaded SLOB. SLOB 2.3 allows one to have either multiple SLOB schemas or the new Single Schema and to drive up the load one can specify how many SLOB threads per schema will be active.


To close out this short blog entry I’ll make note that the SLOB 2.3 data loader is now loading 1TB scale Single Schema in just short of one hour (55.9 minutes exactly). This procedure includes data loading, index creation and CBO statistics gathering. The following was achieved with a moderate IVB-EP 2s20c40t server running Oracle Linux 6.5 and Oracle Database 12c and connected to an EMC XtremIO array via 8GFC Fibre Channel. I think this shows that even the data loader of SLOB is a worthwhile workload in its own right.

SLOB 2.3 Data Loading 1TB/h

Lab Report: Oracle Database on EMC XtremIO. A Compression Technology Case Study.

If you are interested in array-level data reduction services and how such technology mixes with Oracle Database application-level compression (such as Advanced Compression Option), I offer the link below to an EMC Lab Report on this very topic.

To read the entire Lab Report please click the following link:   Click Here.

The following is an excerpt from the Lab Report:

Executive Summary
EMC XtremIO storage array offers powerful data reduction features. In addition to thin provisioning, XtremIO applies both deduplication and compression algorithms to blocks of data when they are ingested into the array. These features are always on and intrinsic to the array. There is no added licensing, no tuning nor configuration involved when it comes to XtremIO data reduction.

Oracle Database also supports compression. The most common form of Oracle Database compression is the Advanced Compression Option—commonly referred to as ACO. With Oracle Database most “options” are separately licensed features and ACO is one such option. As of the publication date of this Lab Report, ACO is licensed at $11,000 per processor core on the database host1. Compressing Oracle Database blocks with ACO can offer benefits beyond simple storage savings. Blocks compressed with ACO remain compressed as they pass through the database host. In short, blocks compressed with ACO will hold more rows of data per block. This can be either a blessing or a curse. Allowing Oracle to store more rows per block has the positive benefit of caching more application data in main memory (i.e., the Oracle SGA buffer pool). On the other hand, compacting more data into each block often results in increased block-contention.

Oracle offers tuning advice to address this contention in My Oracle Support note 1223705.12. However, the tuning recommendations for reducing block contention with ACO also lower the compression ratios. Oracle also warns users to expect higher CPU overhead with ACO as per the following statement in the Oracle Database product documentation:

Compression technology uses CPU. Ensure that you have enough available CPU to handle the additional load.

Application vendors, such as SAP, also produce literature to further assist database administrators in making sensible choices about how and when to employ Advanced Compression Option. The importance of understanding the possible performance impact of ACO are made quite clear in such publications as SAP Note 14363524 which states the following about SAP performance with ACO:

Overall system throughput is not negatively impacted and may improve. Should you experience very long runtimes (i.e. 5-10 times slower) for certain operations (like mass inserts in BW PSA or ODS tables/partitions) then you should set the event 10447 level 50 in the spfile/init.ora. This will reduce the overhead for insertion into compressed tables/partitions.

The SAP note offers further words of caution regarding transaction logging (a.k.a., redo) in the following quote:

Amount of redo data generated can be up to 30% higher

Oracle Database Administrators, with prior ACO experience, are largely aware of the trade-offs where ACO is concerned. Database Administrators who have customarily used ACO in their Oracle Database deployments may wish to continue to use ACO after adopting EMC XtremIO. For this reason Database Administrators are interested in learning how XtremIO compression and Advanced Compression Option interact.

This Lab Report offers an analysis of space savings with and without ACO on XtremIO. In addition, a performance characterization of an OLTP workload manipulating the same application data in ACO and non-ACO tablespaces will be covered…please click the link above to continue reading…


Whitepaper: Oracle Database 11g and 12c Consolidation and Workload Scalability with EMC XtremIO 3.0

This is a just a quick blog post to direct readers to the best Oracle-related paper detailing the value EMC XtremIO brings to Oracle Database use cases.  I’ve been looking forward to the availability of this paper for quite some time as I supported (minimally, really) the EMC Global Solutions Engineering group in this effort. They really did a great job with this testing! I highly recommend this paper for readers who are interested in:

  • Leveraging immediate, space efficient, zero overhead storage snapshots for productivity
  • All-Flash Array performance
  • Database workload consolidation

Click the following link to access the whitepaper: click here.   wp-1 Abstract:

This white paper describes the deployment of the XtremIO® all-flash array with Oracle RAC 11g and 12c databases in both physical and virtual environments. It describes optimal performance while scaling up in a physical environment, the effect of adding multiple virtualized database environments, and the impact of using XtremIO Compression with Oracle Advanced Compression. The white paper also demonstrates the physical space efficiency and low performance impact of XtremIO snapshots.

Adding An EMC XtremIO Volume As An ASM Disk With Oracle Database 12c On Linux – It Does Not Get Any Easier Than This.

When Something Is Simple It Must Be Simple To Prove

Provisioning high-performance storage has always been a chore. Care and concern over spindle count, RAID type, RAID attributes, number of controller arms involved and a long list of other complexities have burdened storage administrators. Some of these troubles were mitigated by the advent of Automatic Storage Management–but not entirely.

Wouldn’t it be nice if the complexity of storage provisioning could be boiled down to but a single factor? Wouldn’t it be nice if that single factor was, simply, capacity? With EMC XtremIO the only factor storage administrators need to bear in mind when provisioning storage is, indeed, capacity.

With EMC XtremIO a storage administrator hears there is a need for, say, one terabyte of storage and that is the entirety of information needed. No more questions about the I/O pattern (e.g., large sequential writes ala redo logging, etc). The Database Administrator simply asks for capacity with a very short sentence and the Storage Administrator clicks 3 buttons in the XtremIO GUI and that’s all there is to it.

Pictures Speak Thousands of Words

I too enjoy the simplicity of XtremIO in my engineering work. Just the other day I ran short on space in a tablespace while testing Oracle Database 12c intra-node parallel query. I was studying a two-node Real Application Clusters setup attached to an EMC XtremIO array via 8 paths of 8GFC Fibre Channel. The task at hand was a single parallel CTAS (Create Table As Select) but the command failed because my ASM disk group ran out of space when Oracle Database tried to extend the BIGFILE tablespace.

Since I had to add some space I thought I’d take a few screen shots to show readers of this blog how simple it is to perform the full cycle of tasks required to add space to an active cluster with ASM in an XtremIO environment.

The following screen shot shows the error I was reacting to:

2015-02-23-pic1

Since the following example shows host configuration steps please note the Linux distribution (Oracle Linux) and kernel version (UEK) I was using:

linux-release

The following screenshot shows the XtremIO GUI configuration tab. I selected “Add” and then typed a name and size (1TB) of the volume I wanted to create:

NOTE: Right click the embedded images for greater clarity

2015-02-23-pic2

The following screenshot shows how I then selected the initiators (think hosts) from the right-hand column that I wanted to see the new volume:

2015-02-23-pic4

After I clicked “apply” I could see my new volume in my “12C” folder. With the folder construct I can do things like create zero-overhead, immediate, writable snapshots with a single mouse click. As the following screenshot shows, I highlighted “data5” so I could get details about the volume in advance of performing tasks on the host. The properties tab shows me the only information I need to proceed–the NAA Identifier. Once I had the NAA Identifier I moved on to the task of discovering the new volume on the hosts.


2015-02-23-pic5

Host Discovery

Host discovery consists of three simple steps:

  1. Multipath discovery
  2. Updating the udev rules file with a text editor
  3. Updating udev state with udevadm commands

Multipath Discovery

On both nodes of the cluster I executed the following series of commands. This series of commands generates a lot of terminal output so I won’t show that in this blog post.

# multipath -F ;service multipathd restart ; rescan-scsi-bus.sh -r

After executing the multipath related commands I was able to see the new volume (0002a) on both nodes of the cluster. Notice how the volume has different multipath names (mpathab, mpathai) on the hosts. This is not an issue since the volumes will be controlled by udev:

2015-02-23-pic7

Updating Udev Rules File and Udev State

After verifying the volumes were visible under DM-MPIO I moved on to the udev actions. The following screenshot shows how I added an ACTION line in the udev rules file and copied it to the other RAC host and then executed the udev update commands on both RAC hosts:

2015-02-23-pic9

I then could see “/dev/asmdisk6” on both RAC hosts:

2015-02-23-pic10

Adding The New XtremIO Volume As An ASM Disk

The next task was to use ASMCA (ASM Configuration Assistant) to add the XtremIO volume to the ASM disk group called “DATA”:

2015-02-23-pic8

As the following screenshot shows the volume is visible as /dev/asmdisk6:

2015-02-23-pic11

I selected asmdisk6 and the task was complete:

2015-02-23-pic12

I then saw evidence of ASM rebalancing in the XtremIO GUI Performance tab:

2015-02-23-pic15


Summary

With EMC XtremIO you provision capacity and that allows you to speak in very short sentences with the application owners that share space in the array.

It doesn’t get any easier than this.


DISCLAIMER

I work for Amazon Web Services. The opinions I share in this blog are my own. I'm *not* communicating as a spokesperson for Amazon. In other words, I work at Amazon, but this is my own opinion.

Enter your email address to follow this blog and receive notifications of new posts by email.

Join 741 other subscribers
Oracle ACE Program Status

Click It

website metrics

Fond Memories

Copyright

All content is © Kevin Closson and "Kevin Closson's Blog: Platforms, Databases, and Storage", 2006-2015. Unauthorized use and/or duplication of this material without express and written permission from this blog’s author and/or owner is strictly prohibited. Excerpts and links may be used, provided that full and clear credit is given to Kevin Closson and Kevin Closson's Blog: Platforms, Databases, and Storage with appropriate and specific direction to the original content.