Archive Page 8

Quick Reference README File For SLOB – The Silly Little Oracle Benchmark

BLOG UPDATE 2012.06.29: For additional how-to help with SLOB please visit Karl Arao’s setup cheat-sheet

This is just a quick blog entry with the main README file from SLOB – The Silly Little Oracle Benchmark. I frequently findings myself referring folks to the README so I thought I’d make it convenient. I’ve also uploaded this in PDF form here.

            SLOB - Silly Little Oracle Benchmark

INDEX
    INTRO
    NOTE ABOUT SMALL SGA
    SETUP STEPS
    RELOADING THE TABLES
    RESULTS
    TERMINOLOGY
    HOW MANY PROCESSES DO I RUN
    NON-LINUX PLATFORMS    

INTRO
-----
This kit does physical I/O. Lot's of it. 

The general idea is that schema users connect to the instance and 
execute SQL on their own tables and indexes so as to eliminate as much SGA *application* sharing as possible. SLOB aims to stress Oracle internal concurrency as opposed to application-contention. It's all about database physical IO ( both physical and logical) not application scaling.

The default kit presumes the existence of a tablespace called IOPS. If 
you wish to  supply another named tablespace it will be given as a 
argument to the setup.sh script. More on this later in this README.

To create the schemas and load data simply execute setup.sh as the Oracle 
sysdba user. The setup.sh script takes two arguments the first being the 
name of the tablespace and the second being how many schema users to load. 
A high-end test setup will generally load 128 users. To that end, 128 is 
the default.

To run the test workload use the runit.sh script. It takes two arguments 
the first being the number of sessions that will attach and perform modify 
DML (UPDATE) on their data (writer.sql) and the second directs how many sessions 
will connect and SELECT against their data (reader.sql). 

NOTE ABOUT SMALL SGA
--------------------
The key to this kit is to run with a small SGA buffer pool to force physical 
I/O. For instance, a 40MB SGA will be certain to result in significant physical 
IOPS when running with about 4 or more reader sessions. Monitor free buffer waits 
and increase db_cache_size to ensure the run proceeds without free buffer wait 
events.

Oracle SGA sizing heuristics may prevent you from creating a very small SGA
if your system has a lot of processor cores. There are remedies for this. 
You can set cpu_count in the parameter file to a small number (e.g., 2) and this
generally allows one to minimize db_block_buffers. Another approach is
to create a recycle buffer pool. The setup.sh script uses the storage 
clause of the CREATE TABLE command to associate all SLOB users' tables
with a recycle pool. If there happens to be a recycle pool when the 
instance is started then all table traffic will flow through that
pool. 

SETUP STEPS
-----------
1. First, create the trigger tools. Change directory to  ./wait_kit 
   and execute "make all"
2. Next, execute the setup.sh script, e.g., sh ./setup.sh IOPS 128
3. Next, run the kit such as sh ./runit.sh 0 8

RELOADING THE TABLES
--------------------
When setup.sh executes it produces a drop_users.sql file. If you need to 
re-run setup.sh it is optimal to execute drop_users.sql first and then 
proceed to re-execute setup.sh.

RESULTS
-------
The kit will produce a text awr report named awr.txt. The "awr" directory 
scripts can be modified to produce a HTML awr report if so desired. 

TERMINOLOGY
-----------
SLOB is useful for the following I/O and system bandwidth testing:

1. Physical I/O (PIO) - Datafile focus
    1.1 This style of SLOB testing requires a small db_block_cache
    setting. Small means very small such as 40MB. Some
    users find that it is necessary to over-ride Oracle's built
    in self-tuning even when supplying a specific value to 
    db_cache_size. If you set db_cache_size small (e.g., 40M)
    but SHOW SGA reveals an over-ride situation, consider 
    setting cpu_count to a very low value such as 2. This will
    not spoil SLOB's ability to stress I/O.
    1.2 Some examples of PIO include the following:
        $ sh ./runit.sh 0 32   # zero writers 32 readers
        $ sh ./runit.sh 32 0   # 32 writers zero readers
        $ sh ./runit.sh 16 16  # 16 of each reader/writer
2. Logical I/O (LIO)
    2.1 LIO is a system bandwidth and memory latency test. This 
    requires a larger db_block_cache setting. The idea is to 
    eliminate Physical I/O. The measurement in this testing mode 
    is Logical I/O as reported in AWR as Logical reads.
3. Redo Focused (REDO)
    3.1 REDO mode also requires a large SGA. The idea is to 
    have enough buffers so that Oracle does not need to
    activate DBWR to flush. Instead, LGWR will be the
    only process on the system issuing physical I/O. This 
    manner of SLOB testing will prove out the maximum theoretical
    redo subsystem bandwidth on the system. In this mode
    it is best to run with zero readers and all writers.

HOW MANY PROCESSES DO I RUN?
----------------------------
I recommend starting out small and scaling up. So, for instance,
a loop of PIO such as the following:
    $ for cnt in 1 2 4 8
    do
        sh ./runit.sh 0 $cnt
    done

Take care to preserve the AWR report in each iteration of the loop.
The best recipe for the number of SLOB sessions is system specific. 
If your system renders, say, 50,000 PIOPS with 24 readers but starts
to tail beyond 24 then stay with 24.

In general I recommend thinking in terms of SLOB sessions per core.

In the LIO case it is quite rare to run with more readers.sql than the
number of cores (or threads in the case of threaded cores). On the other 
hand, in the case of REDO it might take more than the number of cores 
to find the maximum redo subsystem throughput--remember, Oracle does 
piggy-back commits so over-subscribing sessions to cores might be 
beneficial during REDO testing.

NON-LINUX PLATFORMS
-------------------
The SLOB install directory has of README.{PLATFORM} files and 
user-contributed, tested scripts under the ./misc/user-contrib directory.

Xeon E5-2600 OS CPU To Core / SMT Thread Mapping On Linux. It Matters.

Ages ago I blogged about the Intel topology tool and mapping Xeon 5500 (Nehalem EP) processor threads to OS CPUs on Linux. I don’t recall if I ever blogged the same about Xeon 5600 (Westmere EP) but I’ll cover that processor and Xeon E5-2600 in this short post.  First, Xeon 5600.

The following two screen shots are socket 0 and socket 1 from a Xeon 5600 server. Socket 0 first:

Now, socket 1:

So, based on the information above, one would have to specify OS CPUs 0,1,2,3,4,5 if they wanted thread 0 from the first 3 cores on each CPU (c0_t0). I never liked that much. That’s why I’m glad Sandy Bridge presents itself in a more logical manner. As you can see from the following two screen shots, specifying affinity for thread 0 of cores on socket 0 is as simple as 0,1,2,3,4,5,6,7. First, socket 0:

And now, socket 1:

Lest this come off as simple tomfoolery, allow me to show the 2x difference in siphoning off a fifo when the data flows socket-local versus socket-remote:

Be aware that this level of disparity will not necessarily be realized when a server is booted SUMA (nor even when BIOS NUMA is enabled but the grub boot string includes numa=off). I’d test the difference and blog that here but that would just be tomfoolery 🙂

Oracle Database 11g Certification For RHEL6 / OEL6 Has Finally Materialized!

Big news, short post.  I fully expected Oracle to skip certifying 11g on RHEL6 / OEL6 opting instead to encourage (force?) adoption of the next major release 12c.

http://finance.yahoo.com/news/oracle-announces-certification-oracle-database-192400398.html

Update Available For SLOB — The Silly Little Oracle Benchmark.

It’s not really a benchmark, nor silly but it had a silly bug in the driver script (runit.sh). The bug is fixed and the updated tar archive is available here: http://oaktable.net/articles/slob-silly-little-oracle-benchmark

If you compare before and after results you may find that your AWR rates per second for physical I/O and Logical I/O are different. That’s due to the bug. The old version scoped a sleep in the AWR reporting period! Yes, a silly bug in a silly little Oracle benchmark. Only a slob would let that linger.


Yes, File Systems Still Need To Support Concurrent Writes! Yet Another Look At XFS Versus EXT4.

My post entitled File Systems For A Database? Choose One That Couples Direct I/O and Concurrent I/O. What’s This Have To Do With NFS? Harken Back 5.2 Years To Find Out has not been an incredibly popular post by way of page views (averages about 10 per day for the last six months), but it has generated some email from readers asking about EXT4.

I’ve been putting off the topic but it is fresh on my mind.

Today I put out a quick tweet about concurrent writes on Ext4 (https://twitter.com/kevinclosson/status/177111985790525440) that started a small tweet-thread by others looking for clarification.  This blog entry aims to clarify my point about concurrent writes on EXT4 compared to XFS. As an aside, if you have not read the above referenced blog post, and you are interested in concurrent writes and how the topic pertains to several file systems including NFS, I recommend you give it a read.

The topic at hand—EXT4 versus XFS—concurrent write handling is a very brief topic so this will be a brief blog post.  Allow me to explain. The following really sums it up:

EXT4 does not support concurrent writes, XFS does.

So, in spite of the fact that the topic is brief, I’d like to expound upon the matter and offer some proof.

In the following you will see two proof cases—one EXT4 and the other XFS. The proof case is as follows:

  1. The previous file system is unmounted
  2. An XFS file system is created in my md(4) SW RAID LUN
  3. The XFS file system is mounted on /mnt/dsk
  4. A script called simple.sh is executed to prove the volume supports high-performance sequential writes by first initializing a test file through the direct I/O code path
  5. The simple.sh script then measures 196,608 64KB sequential writes to the test file. The file is opened without truncate so this is an operation that merely over-writes the file. The writes are performed with direct I/O.
  6. The simple.sh script then performs concurrent writes of the same file—again the writes are through the direct I/O code path and the file is not truncated. There are two dd(1) processes—one over-writes the first half of the file the other over-writes the second half of the file.

I’ll paste the silly little simple.sh script at the bottom of this post.

The measure of goodness is , of course, whether or not the two-process case is able to push more I/O in aggregate than the single writer case.  You’ll see that with very large writes the LUN can sustain 3.7 GB/s with a single writer through the direct I/O code path on both XFS and EXT4 files. The concurrent versus single write test cases were conducted with 64KB writes. Again, with both file systems (XFS and EXT4) the single writer was able to push 1.4 GB/s. As the following shows, the XFS two-writer case scaled at 1.7x.

Now it’s time to move on to EXT4. Here you’ll see the same baseline of 3.7 GB/s when initializing the file and the familiar 1.4 GB/s for the single 64KB serial writer. That, however, is the extent of the similarities. The two-writer case on EXT4 sadly de-scales. The 2.4 GB/s seen in the XFS case f alls to aggregate of 1048 MB/s with two writers on EXT4.

The following is the simple.sh script:

#!/bin/bash

myfile=$1

echo "Creating test file $myfile using direct I/O"
dd if=/dev/zero of=$myfile bs=1024M count=12 oflag=direct

sync;sync;sync;echo 3 > /proc/sys/vm/drop_caches

echo "Single Direct I/O writer"
( dd if=/dev/zero of=$myfile bs=64K count=196608 conv=notrunc oflag=direct > thread1.out 2>&1 ) &

wait
cat thread1.out

echo "Two Direct I/O writer"
( dd if=/dev/zero of=$myfile bs=64K count=98304 conv=notrunc oflag=direct > thread1.out 2>&1 ) &
( dd if=/dev/zero of=$myfile bs=64K count=98304 seek=98304 conv=notrunc oflag=direct > thread2.out 2>&1 ) &

wait
cat thread1.out thread2.out

Recent Oracle 8-Socket Xeon E7 TPC-C Result. Big NUMA Box, No NUMA Parameters.

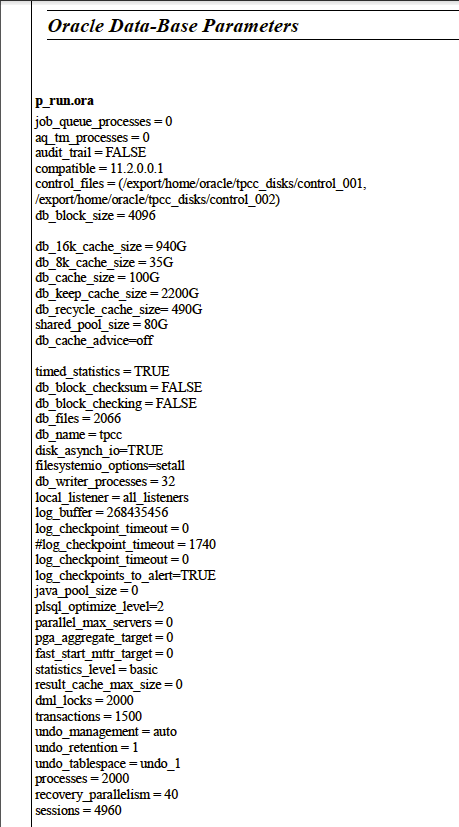
I’ve read through the full disclosure report from Oracle’s January 2012 TPC-C. I’ve found that the result was obtained without using any NUMA init.ora parameters (e.g., enable_NUMA_support). The storage was a collection of Sun x64 servers running COMSTAR to serve up F5100 flash storage. The storage connectivity was 8GFC fibre channel. This was a non-RAC result with 8s80c160t Xeon E7. The only things that stand out to me are:

  1. The settings of disk_async_io=TRUE. This was ASM on raw disk so I should think ASYNC would be the default. Interesting.
  2. Overriding the default number of DBWR processes by setting db_writer_processes. The default number of DBWR processes would be 20 so the benchmark team increased that 60%. Since sockets are NUMA “nodes” on this architecture the default of 20 would render 2.5 DBWR per “node.” In my experience it is beneficial to have DBWR processes an equal multiple of the number of sockets (NUMA nodes) so if the benchmark team was thinking the way I think they went with 4x socket count.

The FDR is here: http://c970058.r58.cf2.rackcdn.com/fdr/tpcc/Oracle_X4800-M2_TPCC_OL-UEK-FDR_011712.pdf

For more information about the missing enable_NUMA_support parameter see: Meet _enable_NUMA_support: The if-then-else Oracle Database 11g Release 2 Initialization Parameter.

For a lot more about NUMA as it pertains to Oracle, please visit: QPI-Based Systems Related Topics (e.g., Nehalem EP/EX, Westmere EP, etc)

On the topic of increasing DBWR processes I’d like to point out that doing so isn’t one of those “some is good so more must be better” situations. For more reading on that matter I recommend:

Over-Configuring DBWR Processes Part I

Over-Configuring DBWR Processes Part II

Over-Configuring DBWR Processes Part III

Over-Configuring DBWR Processes Part IV

The parameters:

Got A Big NUMA Box For Running Oracle? Take Care To Get Interrupt Handling Spread Across The Sockets Evenly
Page 310 of the FDR shows the following script used to arrange good affinity between the FC HBA device drivers and the sockets. I had to do the same sort of thing with the x4800 (aka Exadata X2-8) back before I left Oracle’s Exadata development organization. This sort of thing is standard but I wanted to bring the concept to your attention:


#!/bin/bash
 service irqbalance stop
 last_node=-1
 declare -i count=0
 declare -i cpu cpu1 cpu2 cpu3 cpu4
 for dir in /sys/bus/pci/drivers/qla2xxx/0000*
do
 node=`cat $dir/numa_node`
 irqs=`cat $dir/msi_irqs`
 if [ "`echo $irqs | wc -w`" != "2" ] ; then
 echo >&2 "script expects 2 interrupts per device"
 exit 1
 fi
first_cpu=`sed 's/-.*//' < $dir/local_cpulist` 
echo $node $irqs $first_cpu $dir done | sort | while read node irq1 irq2 cpu1 dir 
do 
cpu2=$cpu1+10 
cpu3=$cpu1+80 
cpu4=$cpu1+90 
if [ "$node" != "$last_node" ]
then 
count=1 cpu=$cpu1 
else 
count=$count+1 
case $count in 
2) cpu=$cpu2;; 
3) cpu=$cpu3;; 
4) cpu=$cpu4;; 
*) echo "more devices than expected on node $node" count=1 cpu=$cpu1;; 
esac 
fi 
last_node=$node 
echo "#$dir" 
echo "echo $cpu > /proc/irq/$irq1/smp_affinity_list"
 echo "echo $cpu > /proc/irq/$irq2/smp_affinity_list"
 echo
 echo $cpu > /proc/irq/$irq1/smp_affinity_list
 echo $cpu > /proc/irq/$irq2/smp_affinity_list
 done

Modern Servers Are Better Than You Think For Oracle Database – Part I. What Problems Actually Need To Be Fixed?

Blog update 2012.02.28: I’ve received countless inquiries about the storage used in the proof points I’m making in this post. I’d like to state clearly that the storage is  not a production product, not a glimpse of something that may eventually become product or any such thing. This is a post about CPU, not about storage. That point will be clear as you read the words in the post.

In my recent article entitled How Many Non-Exadata RAC Licenses Do You Need to Match Exadata Performance I brought up the topic of processor requirements for Oracle with and without Exadata. I find the topic intriguing. It is my opinion that anyone influencing how their company’s Oracle-related IT budget is used needs to find this topic intriguing.

Before I can address the poll in the above-mentioned post I have to lay some groundwork. The groundwork I need to lay will come in this and an unknown number of installments in a series.

Exadata for OLTP

There is no value add for Oracle Database on Exadata in the OLTP/ERP use case. Full stop. OLTP/ERP does not offload processing to storage. Your full-rack Exadata configuration has 168 Xeon 5600 cores in the storage grid doing practically nothing in this use case. Or, I should say, the processing that does occur in the Exadata storage cells (in the OLTP/ERP use case) would be better handled in the database host. There simply is no value in introducing off-host I/O handling (and all the associated communication overhead) for random single-block accesses. Additionally, since Exadata cannot scale random writes, it is actually a very weak platform for these use cases. Allow me to explain.

Exadata Random Write I/O
While it is true Exadata offers the bandwidth for upwards of 1.5 million read IOPS (with low latency) in a full rack X2 configuration, the data sheet specification for random writes is a paltry 50,000 gross IOPS—or 25,000 with Automatic Storage Management normal redundancy. Applications do not exhibit 60:1 read to write ratios. Exadata bottlenecks on random writes long before an application can realize the Exadata Smart Flash Cache datasheet random read rates.

Exadata for DW/BI/Analytics

Oracle positions Exadata against products like EMC Greenplum for DW/BI/Analytics workloads. I fully understand this positioning because DW/BI is the primary use case for Exadata. In its inception Exadata addressed very important problems related to data flow. The situation as it stands today, however, is that Exadata addresses problems that no longer exist. Once again, allow me to explain.

The Scourge Of The Front-Side Bus Is Ancient History. That’s Important!
It was not long ago that provisioning ample bandwidth to Real Application Clusters for high-bandwidth scans was very difficult. I understand that. I also understand that, back in those days, commodity servers suffered from internal bandwidth problems limiting a server’s data-ingest capability from storage (PCI->CPU core). I speak of servers in the pre-Quick Path Interconnect (Nehalem EP) days.  In those days it made little sense to connect more than, say, two active 4GFC fibre channel paths (~800 MB/s) to a server because the data would not flow unimpeded from storage to the processors. The bottleneck was the front-side bus choking off the flow of data from storage to processor cores. This fact essentially forced Oracle’s customers to create larger, more complex clusters for their RAC deployments just to accommodate the needed flow of data (throughput).  That is, while some customers toiled with the most basic problems (e.g., storage connectivity), others solved that problem but still required larger clusters to get more front-side buses involved.

It wasn’t really about the processor cores. It was about the bus. Enter Exadata and storage offload processing.

Because the servers of yesteryear had bottlenecks between the storage adapters and the CPU cores (the front-side bus) it was necessary for Oracle to devise a means for reducing payload between storage and RAC host CPUs. Oracle chose to offload the I/O handling (calls to the Kernel for physical I/O), filtration and column projection to storage. This functionality is known as a Smart Scan. Let’s just forget for a moment that the majority of CPU-intensive processing, in a DW/BI query,  occurs after filtration and projection (e.g., table joins, sort, aggregation, etc). Shame on me, I digress.

All right, so imagine for a moment that modern servers don’t really need the offload-processing “help” offered by Exadata? What if modern servers can actually handle data at extreme rates of throughput from storage, over PCI and into the processor cores without offloading the lower level I/O and filtration? Well, the answer to that comes down to how many processor cores are involved with the functionality that is offloaded to Exadata. That is a sophisticated topic, but I don’t think we are ready to tackle it yet because the majority of datacenter folks I interact with suffer from a bit of EarthStillFlat(tm) syndrome. That is, most folks don’t know their servers. They still think it takes lots and lots of processor cores to handle data flow like it did when processor cores were held hostage by front-side bus bottlenecks. In short, we can’t investigate how necessary offload processing is if we don’t know anything about the servers we intend to benefit with said offload. After all, Oracle database is the same software whether running on a Xeon 5600-based server in an Exadata rack or a Xeon 5600-based server not in an Exadata rack.

Know Your Servers

It is possible to know your servers. You just have to measure.

You might be surprised at how capable they are. Why presume modern servers need the help of offloading I/O (handling) and filtration. You license Oracle by the processor core so it is worthwhile knowing what those cores are capable of. I know my server and what it is capable of. Allow me to share a few things I know about my server’s capabilities.

My server is a very common platform as the following screenshot will show. It is a simple 2s12c24t Xeon 5600 (a.k.a. Westmere EP) server:

My server is attached to very high-performance storage which is presented to an Oracle database via Oracle Managed Files residing in an XFS file system in a md(4) software RAID volume. The following screenshot shows this association/hierarchy as well as the fact that the files are accessed with direct, asynchronous I/O. The screenshot also shows that the database is able to scan a table with 1 billion rows (206 GB) in 45 seconds (4.7 GB/s table scan throughput):

The io.sql script accounts for the volume of data that must be ingested to count the billion rows:

$ cat io.sql
set timing off
col physical_reads_GB format 999,999,999;      
select VALUE /1024 /1024 /1024 physical_reads_GB from v$sysstat where STATISTIC# =
(select statistic# from v$statname where name like '%physical read bytes%');
set timing on

So this simple test shows that a 2s12c24t server is able to process 392 MB/s per processor core. When Exadata was introduced most data centers used 4GFC fibre channel for storage connectivity. The servers of the day were bandwidth limited. If only I could teleport my 2-socket Xeon 5600 server back in time and put it next to an Exadata V1 box. Once there, I’d be able to demonstrate a 2-socket server capable of handling the flow of data from 12 active 4GFC FC HBA ports! I’d be the talk of the town because similar servers of that era could neither connect as many active FC HBAs nor ingest the data flowing over the wires—the front-side bus was the bottleneck. But, the earth does not remain flat.

The following screenshot shows the results of five SQL statements explained as:

  1. This SQL scans all 206 GB, locates the 4 char columns (projection) in each row and nibbles the first char of each. The rate of throughput is 2,812 MB/s. There is no filtration
  2. This SQL ingests all the date columns from all rows and maintains 2,481 MB/s. There is no filtration.
  3. This SQL combines the efforts of the previous two queries which brings the throughput down to 1,278 MB/s. There is no filtration.
  4. This SQL processes the entire data mass of all columns in each row and maintains 1,528 MB/s. There is no filtration.
  5. The last SQL statement introduces filtration. Here we see that the platform is able to scan and selectively discard all rows (based on a date predicate) at the rate of 4,882 MB/s. This would be akin to a fully offloaded scan in Exadata that returns no rows.

Summary

This blog series aims to embark on finding good answers to the question I raised in my recent article entitled How Many Non-Exadata RAC Licenses Do You Need to Match Exadata Performance. I’ve explained that offload to Exadata storage consists of payload reduction. I also offered a technical, historical perspective as why that was so important. I’ve also showed that a small, modern QPI-based server can flow data through processor cores at rates ranging from 407 MBPS/core down to 107 MBPS/core depending on what the SQL is doing (SQL with no predicates mind you).

Since payload reduction is the primary value add of Exadata I finished this installment in the series with an example of a simple 2s12c24t Xeon 5600 server filtering out all rows at a rate of 4,882 MB/s—essentially the same throughput as a simple count(*) of all rows as I showed earlier in this post. That is to say that, thus far, I’ve shown that my little lab system can sustain nearly 5GB/s disk throughput whether performing a simple count of rows or filtering out all rows (based on a date predicate). What’s missing here is the processor cost associated with the filtration and I’ll get to that soon enough.

We can’t accurately estimate the benefit of offload until we can accurately associate CPU cost to filtration.  I’ll take this blog series to that point over the next few installments—so long as this topic isn’t too boring for my blog readers.

This is part I in the series. At this point I hope you are beginning to realize that modern servers are better than you probably thought. Moreover, I hope my words about the history of front-side bus impact on sizing systems for Real Application Clusters is starting to make sense. If not, by all means please comment.

As this blog series progresses I aim to help folks better appreciate the costs of performing certain aspects of Oracle query processing on modern hardware. The more we know about modern servers the closer we can get to answer the poll more accurately. You license Oracle by the processor core so it behooves you to know such things…doesn’t it?

By the way, modern storage networking has advanced far beyond 4GFC (400 MB/s).

Finally, as you can tell by my glee in scanning Oracle data from an XFS file system at nearly 5GB/s (direct I/O), I’m quite pleased at the demise of the front-side bus! Unless I’m mistaken, a cluster of such servers, with really fast storage, would be quite a configuration.

How Many Non-Exadata RAC Licenses Do You Need To Match Exadata Performance?

This post is about exaggeration.

The Oracle Database running in the Database Grid of an Exadata Database Machine is the same as what you can run on any Linux x64 server. Depending on the workload (OLTP/ERP/DW.BI.Analytics) there is the variable of storage offload processing freeing up some cycles on the RAC grid when running Exadata. Yes, that is true.

We all know the only thing that really costs Oracle IT shops is Oracle’s licensing and Oracle’s license model is per-processor.

So the big question is whether spending a significant amount of money for Exadata storage actually reduces the Oracle Database licensing cost due to offload processing. Or, in other words, does the magic of Exadata offload processing save you money.

That’s an interesting topic but before I even blog about it I have to wonder how a company like Oracle aims to improve their bottom line by undercutting their high-margin product space (i.e., RAC licenses)  just to push in low-margin storage products (products based entirely on commodity x64 componentry)  like Exadata? Oh well, who knows? Actually, I can answer that. The investors that think Oracle is a hardware company (as a result of buying Sun Microsystems in 2010) want to see some tin hitting the shipping dock. Really? Swapping high-margin for low-margin? Perhaps it’s a buy high, sell low play where the goal is to make up for it with volume. Hah. I call that ExaMath(tm).

I have heard ridiculous claims concerning how many non-Exadata Linux x64 cores one requires to match the same number of licensed database server cores in an Exadata environment. And when I say ridiculous, I really mean absurd.  But it all comes down to how much you pay for the cores in Exadata storage and what percentage of work is offloaded from the RAC grid to the storage grid. Indeed, if, for instance, 90% of the RDBMS effort is offloaded from the RAC grid to the storage grid in Exadata you’d need 90% fewer excruciatingly expensive RAC licenses to service an application than you would without Exadata storage. That’s an interesting idea and if it helps Oracle sales folks clinch a deal or two I’m sure everyone is all the merrier. As the person cutting the purchase order for the software, aren’t you overjoyed? No? Please, read on.

How Much Offload Processing Will Occur With Your Application?
That depends. However, if you are buying the solution then the onus is upon you to figure that out before you spend money. If there is not a significant amount of offload processing for your application then you paid for a lot of processors that are doing nearly nothing to improve your application performance.

Just for fun sake, please participate in this poll. Your answer may reflect what your Oracle sales team is telling you or it may reflect your perception from Oracle marketing. Either way, let’s see how this goes:

Exaggeration Poll

Introducing SLOB – The Simple Database I/O Testing Toolkit for Oracle Database

Please note, the SLOB Resources page is always the sole, official location to obtain SLOB software and documentation:  SLOB Resource Page.

Please visit the following post for a long list of industry vendors’ use cases for SLOB. SLOB has become the primary tool kit for testing a platform’s suitability for Oracle Database. The following blog post makes this case rather strongly: Industry Vendors’ SLOB Use Cases

Background

We’ve all been there.  You’re facing the need to assess Oracle random physical I/O capability on a given platform in preparation for OLTP/ERP style workloads. Perhaps the storage team has assured you of ample bandwidth for both high-throughput and high I/O operations per second (IOPS).  But you want to be sure and measure for yourself so off you go looking for the right test kit.

There is no shortage of transactional benchmarks such as Hammerora, Dominic Giles’ Swingench, and cost-options such as Benchmark Factory.  These are all good kits. I’ve used them all more than once over the years. The problem with these kits is they do not fit the need posed in the previous paragraph.  These kits are transactional so the question becomes whether or not you want to prove Oracle scales those applications on your hardware or do you want to test database I/O characteristics? You want to test database I/O! So now what?

What About Orion?

The Orion tool has long been a standard for testing Oracle block-sizes I/O via the same I/O libraries linked into the Oracle server.  Orion is a helpful tool, but it can lead to a false sense of security.  Allow me to explain. Orion uses no measurable processor cycles to do its work. It simply shovels I/O requests into the kernel and the kernel (driver) “clobbers” the same I/O buffers in memory with the I/O (read) requests again and again. Additionally, Orion does not involve an Oracle Database instance at all! Finally, Orion does not care about the contents of I/O buffers (no load/store operations to/from the I/O buffers before or after physical I/O) and therein lies the weakness of Orion for testing database I/O. It’s not database I/O! Neither is CALIBRATE_IO for that matter. More on that latter…

At one end of the spectrum we have fully transactional application-like test kits (e.g., Swingbench) or low-level I/O generators like Orion. What’s really needed is something right in the middle and I propose that something is SLOB.

What’s In A Name?

SLOB is not a database benchmark. SLOB is an Oracle I/O workload generation tool kit.  I need to point out that by force of habit many SLOB users refer to SLOB with terms like benchmark and workload interchangeably. SLOB aims to fill the gap between Orion and CALIBRATE_IO (neither generate legitimate database I/O as explained partly here) and full-function transactional benchmarks (such as Swingbench). Transactional workloads are intended to test the transactional capability of a database.

I assert that by the time customers license Oracle Database they are quite certain Oracle Database is a very robust and capable ACID-compliant transactional engine and unless you are testing your transactions it makes little sense to test any transactions. That is just my opinion and partial motivation behind my desire to create SLOB–a non-transactional database I/O workload generator.

SLOB possesses the following characteristics:

  1. SLOB supports testing Oracle logical read (SGA buffer gets) scaling
  2. SLOB supports testing physical random single-block reads (db file sequential read)
  3. SLOB supports testing random single block writes (DBWR flushing capacity)
  4. SLOB supports testing extreme REDO logging I/O
  5. SLOB consists of simple PL/SQL
  6. SLOB is entirely free of all application contention

Yes, SLOB is free of application contention yet it is an SGA-intensive workload kit. You might ask why this is important. If you want to test your I/O subsystem with genuine Oracle SGA-buffered physical I/O it is best to not combine that with application contention.

SLOB is also great for logical read scalability testing which is very important, for one simple reason: It is difficult to scale physical I/O if the platform can’t scale logical I/O. Oracle SGA physical I/O is prefaced by a cache miss and, quite honestly, not all platforms can scale cache misses. Additionally, cache misses cross paths with cache hits. So, it is helpful to use SLOB to test your platform’s ability to scale Oracle Database logical I/O.

What’s In The Kit?

There are no benchmark results included–because SLOB is not a benchmark as such. The kit does, however, include:

  • README files and documentation. After extracting the SLOB tar archive you can find the documentation under the “doc” directory in PDF form.
  • A simple database creation kit.  SLOB requires very little by way of database resources. I think the best approach to testing SLOB is to use the simple database creation kit under ~/misc/create_database_kit.  The directory contains a README to help you on your way. I generally recommend folks use the simple database creation kit to create a small database because it uses Oracle Managed Files so you simply point it to the ASM diskgroup or file system you want to test. The entire database will need no more than 10 gigabytes.
  • An IPC semaphore based trigger kit.  I don’t really need to point out much about this simple IPC trigger kit other than to draw your attention to the fact that the kit does require permissions to create a semaphore set with a single semaphore. The README-FIRST file details what you need to do to have a functional trigger.
  • The workload scripts. The setup script is aptly named setup.sh and to run the workload you will use runit.sh. These scripts are covered in README-FIRST.

Models

The size of the SGA buffer pool is the single knob to twist for which workload profile you’ll generate. For instance, if you wish to have nothing but random single block reads you simply run with the smallest db_cache_size your system will allow you to configure (see README-FIRST for more on this matter).  On the other hand, the opposite is what’s needed for logical I/O testing. That is, simply set db_cache_size to about 4GB, perform a warm-up run and from that point on there will be no physical I/O. Drive up the number of connected pseudo users and you’ll observe logical I/O scale up bounded only by how scalable your platform is.  The other models involve writes. If you want to drive a tremendous amount of REDO writes you will again configure a large db_cache_size and execute runit.sh with only write sessions. From that point you can reduce the size of db_cache_size while maintaining the write sessions, which will drive DBWR into a frenzy.

Who Uses SLOB?

SLOB is extremely popular and heavily used. SLOB testing is featured in many industry vendor published articles, books, blogs and so forth. Google searching for SLOB-related content offers a rich variety of information. Additionally, I maintain a page of notable SLOB use cases in the industry at the following web page:

SLOB Use Cases in the Industry

What You Should Expect From SLOB

I/O, lots of it! Oh, and the absolute minimal amount of CPU overhead possible considering SLOB generates legitimate SQL-driven, SGA-buffered physical I/O!

Where Is The Kit?

The only official place to obtain SLOB is at the following web page:

SLOB Resources Page (SLOB distribution and helpful information)


EMC Oracle-Related Reading Material of Interest.

Lately I’ve been reading a lot more than writing as is evident by my low-frequency blogging. Here is some of the material I’ve been going through:

Recent SPARC T4-4 TPC-H Results Prove Oracle Can Do Better Than…Oracle! Part II.

My recent post entitled Recent SPARC T4-4 TPC-H Benchmark Results. Proving Bandwidth! But What Storage? provoked the following comment/question  from a reader:

Does this summarize your point(s)?

TPC-H produces a number which is a reflection of (hourly?!?) system throughput.

System throughput may not be indicative of system “performance” to its uses b/c users are typically most intersted in response time. Thus, TPC-H is a easily mis-used benchmark for comparing real world performance.

Oracle is using our misunderstanding of throughput as performnace to Market systems which are excellent throughput machines as excellent performance machines, when in fact their performance may be less then desirable.

I hope the reader took the time to read yesterday’s post entitled Recent SPARC T4-4 TPC-H Results Prove Oracle Can Do Better Than…Oracle as I think it goes a long way to address his comment/question. However, I do think the reader’s question deserves proper handling and thus I’m making this blog entry. So, dear reader, the following is my response to your comment/questions, but first I need to clear the air as it were.

There Is No Evil Lurking In This Thread
Let me first state categorically that Oracle is not “using our misunderstanding […] to Market systems […]” They are not doing anything under-handed with these TPC-H results.  They are, however, conveniently failing to compare their results to their own prior results. I only brought up the HP Proliant DL980 SQL Server results because Oracle did so in their press release.

Comparisons
I really do not like to compare TPC-H results across database vendor lines. The benchmark is too tricked out, it is a 3rd normal form schema and many other things about it make it just a goofy benchmark—if you have data warehousing in mind.  Nevertheless, comparisons between a given database vendor are useful for many purposes—such as suiting my ulterior motive which is to suggest that Oracle runs better on platforms other than their very own (recently acquired) SPARC processors.

Before I continue I’d like to interject a proclamation. In fact, I’ll quote myself if you’ll suffer me to do so:

Lack of published TPC-H results does not in any way disqualify any technology offering in the data warehousing space. There are no Oracle Exadata Database Machine  TPC-H results and that does not amount to a hill of beans. There are also no Teradata, EMC Greenplum  nor IBM Netezza results either and none of those beans form a hill.

— Kevin Closson

The point truly is that TPC-H does not reflect DW/BI/Big Data Analytics reality. However,  if a vendor like Oracle chooses to publish results then by all means I’m going to use those results to make my point—but only comparing Oracle’s own results. That’s precisely what I did I in my post entitled Recent SPARC T4-4 TPC-H Results Prove Oracle Can Do Better Than…Oracle.

Now, on to address the readers’ questions.

Throughput is a performance metric and a valid one indeed. However, throughput is generally derived by a concurrent workload of individual units of work that are individually measurable.  Consider disk throughput. If I tell you I have a storage configuration that satisfies, say, 500,000 I/O operations per second (IOPS) but don’t tell you the average service times I’m leaving out a critical piece of information.

How is the IOPS metric calculated? One samples I/O completions for a given period of time and then divides by the number of seconds sampled. It’s only measuring completions. If I have a tremendous number of I/O operations in flight concurrently, and sustained, I can get 500,000 IOPS even if the average completion time is 1 second.  They overlap.  The same goes for query workloads.

If you submit a continual, large stream of a variety of long running queries you get throughput.  Simply run such a hypothetical workload for a long time, sum up the completions and divide by sample period (time) and you get queries per unit of time.  Simple.

For example, if I have 10,000 concurrent queries requiring, on average, 61 minutes monitored for 2 hours I’ll get 10,000 completions or 5,000 queries per hour. So long as that meets my service requirement I’m fine.  However, if even one of my users mandates a 20 minute completion time I’m not going to impress with hand-waving over the great 5,000 QpH throughput I’m pushing through the system. Users really don’t care about how much work the system is doing on behalf of others. Do they?

So, to continue in this three-part series I’ll have to refer once again to the TPH-H disclosures (cited below).

I’ll refer again to the SPARC T4-4 result. If you glance at the report you’ll see that when submitted serially the geometric mean of query completion times is about 20 seconds on the SPARC T4. On the other hand, when we look at the HP BladeSystem result of over 3 years ago (still with Oracle Database 11g) we see that the geometric mean of serially submitted queries is nearly indiscernible…a mere blip. Of course the astute reader will point out that these comparisons—while both Oracle Database 11g—are that of in-memory versus disk-based (since the HP BladeSystem result was an In-Memory Parallel Query result). To that I would reply that it is foremost an old, tired Harpertown Xeon (5400) result with front-side bus technology compared to a state of the art, modern CPU (SPARC T4). And let’s not forget that the SPARC T4 server was connected to solid state storage!

It’s Not Fair Comparing Oracle In-Memory Parallel Query To Flash Storage
Really? Even considering how primitive a Harpertown Xeon was compared to a modern processor like SPARC T4? OK, fine. We can also harken back further to nearly 5 years to a result achieved by the now-defunct systems vendor called PANTA Systems. The PANTA System configuration, at the same 1TB scale, carried the following baggage:

  • Oracle Database 10g (with Real Application Clusters). So, old software.
  • Really, really old AMD Opteron 8000’s (very, very slow by today’s standards).
  • DDR400 DIMMs.

In spite of this aged bio, the configuration produced a geometric mean of 49 seconds for the serially submitted query stream compared to the 20 second result for the SPARC T4.

That’s a vintage 5 year old system, 10g versus 11g, AMD 8000 versus SPARC T4, DDR400 (not even DDR2) versus DDR3 memory and, lest I forget, the PANTA System memory controller was located across a front-side bus compared to the on-die SPARC memory controller. Tally up all of those contrasting system attributes and the resultant benefit to SPARC T4-4 is about 2.5-fold improvement in the geometric mean of query response times (serial). And, yes, time and technology did bring a a 7x increase in the throughput metric…but…once again, I encourage you to look at the disclosures I link to below and see how the completion times stack up in the throughput tests. If  you do so then we will have come full circle.

No, Oracle is not misleading anyone with these recent SPARC T4 results.

http://tpc.org/results/individual_results/Oracle/Oracle_T4-4_1TB_TPCH_ES_092611.pdf

http://tpc.org/results/individual_results/HP/HP_BladeSystem128P_090603_TPCH_ES_v2.pdf

http://tpc.org/results/individual_results/PANTA/PANTAmatrix_tpch_1TB_061019_es.pdf

Recent SPARC T4-4 TPC-H Results Prove Oracle Can Do Better Than…Oracle!

I made a blog entry yesterday entitled Recent SPARC T4-4 TPC-H Benchmark Results. Proving Bandwidth! But What Storage? wherein I discussed some recent Oracle SPARC T4 TPC-H benchmark results. I pointed out in the post that the T4-4 is an extreme high-bandwidth server as is evidenced by how closely it performs the same benchmark with only half the processors (sockets) as a recent HP Proliant DL980 result.  I then glued in some screen shots of the disclosure reports to elaborate on the point of bandwidth versus latency. You can push a lot of work through a SPARC T4-4, but that doesn’t mean each individual unit of work is all that fast—relatively speaking.  This was even more so the case with the T3 platform before it.

Single stream Oracle workloads were horrible on the T3 platform, but as one scaled up the workload one could find near-parity between T3 and even Nehalem EP (as per my personal testing). That parity, mind you, is on a socket-for-socket basis.

Lest anyone think I’m being flamboyant regarding my comments on single-stream T3 Oracle performance, just talk to anyone that has ever run the Oracle imp command to import data into a database on a SPARC T3 system.  Miserable, and only one example of the sort of single-stream workloads that didn’t shine on the T3.  But that isn’t what I’m blogging about.

Reader Feedback
I received several emails from readers asking for small clarifications regarding yesterday’s blog entry. They were pretty light questions so I answered them. I also got an email with what I refer to as a passively aggressive interrogative assertion:

Can’t you make valid comparisons?

The answer to that would be, yes, of course. That’s what I did. The comparison I made was between HP Proliant DL980 with SQL Server and the Sun SPARC T4 with, of course, Oracle Database 11g in the same scale factor TPC-H.  That’s a valid comparison. I’d ordinarily just reply to such an email with a convenient URL to the tpc.org website because the information is all there. However, I gave it some thought and decided I should post a follow-up so regular readers don’t think I’m reaching for straws on a comparison.

So, please put your sarcasm meter on when you read the next sentence. Maybe I should show a comparison between two relatively similar results. The similarities are:

  1. Both SPARC
  2. Both Solaris 10
  3. Both Oracle Database 11g (the same bits)
  4. The same scale
  5. The same storage!
  6. The same calendar year (within close to 3 months of each other)
  7. Within 4% in QphH terms

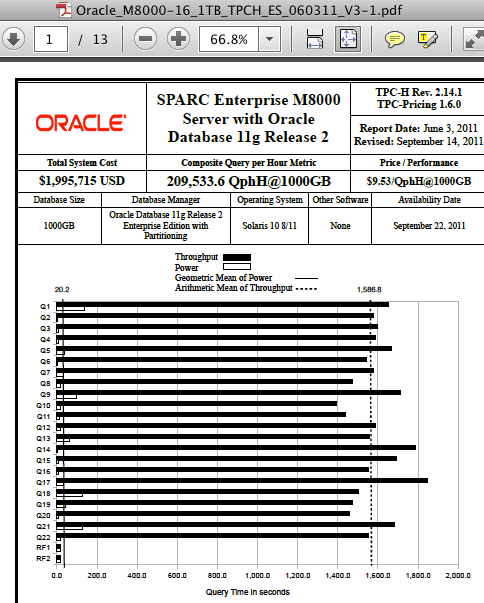
The following screen shots are SPARC Enterprise M8000  versus SPARC T4-4:

SPARC T4-4:

M800:

The SPARC results are quite similar. Maybe that’s just how Oracle Database behaves at the 1TB scale? No, it’s not.

Can Oracle Do Better Than…Oracle? Yes.
We can harken back to a couple of years to find an Oracle Database 11g result that looks dramatically different. I’m referring to the last audited TPC benchmark conducted with Oracle in partnership with HP. The benchmark was a large blade cluster at the 1TB scale with Oracle Database 11g In-Memory Parallel Query. Sure, the configuration was much larger and costlier but did it perform accordingly? Yes.

The following is a link to the disclosure. http://tpc.org/tpch/results/tpch_result_detail.asp?id=109060301

The cost of the system was about 7x more than the recent 1TB SPARC T4 (with all flash storage) result and delivered just short of 6x the throughput. When you glance at the following screen shot characterizing the query completion times you’ll understand when I suggest that, yes, Oracle probably can do better than…Oracle (SPARC that is).

Recent SPARC T4-4 TPC-H Benchmark Results. Proving Bandwidth! But What Storage?

On 30 November, 2011 Oracle published the second result in a recent series of TPC-H benchmarks. The prior result was a 1000GB scale result with a single SPARC T4-4 connected to 4 Sun Storage F5100 Flash Arrays configured as direct attached storage (DAS).  We can ascertain the DAS aspect by reading the disclosure report where we see there were 16 SAS host bus adaptors in the T4-4. As an aside, I’d like to point out that the F5100 is “headless” which means in order to provision Real Application Clusters storage one must “front” the device with a protocol head (e.g., COMSTAR) such as Oracle does when running TPC-C with the SPARC SuperCluster. I wrote about that style of storage presentation in one of my recent posts about SPARC SuperCluster. It’s a complex approach, is not a product, but it works.

The more recent result, published on 30 November, was a 3000TB scale result with a single SPARC T4-4 server and, again, the storage was DAS. However, this particular benchmark used Sun Storage 2540-M2 (OEMed storage from LSI or Netapp?) attached with Fibre Channel. As per the disclosure report there were 12 8GFC FC HBAs (dual port) for a maximum read bandwidth of 19.2GB/s (24 x 800MB/s). The gross capacity of the storage was 45,600GB which racked up entirely in a single 42U rack.

So What Is My Take On All This?

Shortly after this 3TB result went public I got an email from a reader wondering if I intended to blog about the fact that Oracle did not use Exadata in this benchmark. I replied that I am not going to blog that point because while TPC-H is an interesting workload it is not a proper DW/BI workload. I’ve blogged about that fact many times in the past. The lack of Exadata TPC benchmarks is in itself a non-story.

What I do appreciate gleaning from these results is information about the configurations and, when offered, any public statements about I/O bandwidth achieved by the configuration.  Oracle’s press release on the benchmark specifically called out the bandwidth achieved by the SPARC T4-4 as it scanned the conventional storage via 24 8GFC paths. As the following screen shot of the press release shows, Oracle states that the single-rack of conventional storage achieved 17 GB/s.

Oracle Press Release: 17 GB/s Conventional Storage Bandwidth.

I could be wrong on the matter, but I don’t believe the Sun Storage 2540 supports 16GFC Fibre Channel yet. If it had, the T4-4 could have gotten away with as few as 6 dual-port HBAs. It is my opinion that 24 paths is a bit cumbersome. However, since it wasn’t a Real Application Clusters configuration, the storage network topology even with 24 paths would be doable by mere mortals. But, again, I’d rather have a single rack of storage with a measly 12 FC paths for 17 GB/s and since 16GFC is state of the art that is likely how a fresh IT deployment of similar technology would transpire.

SPARC T4-4 Bandwidth

I do not doubt Oracle’s 17GB/s measurement in the 3TB result. The fact is, I am quite astounded that the T4-4 has the internal bandwidth to deal with 17GB/s data flow. That’s 4.25GB/s of application data flow per socket. Simply put, the T4-4 is a very high-bandwidth server. In fact, when we consider the recent 1T result the T4-4 came within about 8% of the HP Proliant DL980 G7 with 8 Xeon E7 sockets and their PREMA chipset . Yes, within 8% (QphH) of 8 Xeon E7 sockets with just 4 T4 sockets. But is bandwidth everything?

The T4 architecture favors highly-threaded workloads just like the T3 before it. This attribute of the T4 is evident in the disclosure reports as well. Consider, for instance, that the 1TB SPARC T4 test was conducted with 128 query streams whereas the HP Proliant DL980 case used 7. The disparity in query response times between these two configurations running the same scale test is quite dramatic as the following screen shots of the disclosure reports show. With the HP DL980, only query 18 required more than 300 seconds of processing whereas not a single query on the SPARC T4 finished in less than 1200 seconds.

DL980:

SPARC T4:

Summary

These recent SPARC T4-4  TPC result proved several things:

1.    Conventional Storage Is Not Dead. Achieving 17GB/s from storage with limited cabling is nothing to sneeze at.

2.    Modern servers have a lot of bandwidth.

3.    There is a vast difference between a big machine and a fast machine. The SPARC T4 is a big (bandwidth) system.

Finally, I did not blog about the fact that the SPARC T4 TPC-H benchmarks do not leverage Exadata storage. Why? Because it simply doesn’t matter. TPC-H is not a suitable test for a system like Exadata. Feel free to Google the matter…you’ll likely find some of my other writings stating the same.

Is 61.11% Fragmentation Too Fragmented For An XFS File System? No!

Thought of the day:

An XFS file system with 98% free space, 6 files and 61.11% fragmentation:

# df -h .
 Filesystem Size Used Avail Use% Mounted on
 /dev/sdb1 100G 1.1G 99G 2% /test
 #
 # find . -type f -print | wc -l
 6
 # xfs_db -r -c frag /dev/sdb1
 actual 18, ideal 7, fragmentation factor 61.11%

When I asked about this oddity in a conversation with Dave Chinner (XFS Kernel owner) I was expecting a lot of complex background on what this 61.11% actually means. His response? I’ll quote:

18 – 7 / 18 = 0.6111111

[…]it’s been that way forever. Ignore it – it’s much more important to look at the files themselves […]

I like Dave’s candor and have found that individual file analysis does yield  interesting information as well as I showed in my post entitled Little Things Doth Crabby Make – Part XVII. I See xfs_mkfile(8) Making Fragmented Files.

As for deprecated tools, I also have no problem with that. There may have been a day when this command spat out useful information (perhaps in XFS’s previous SGI Unix life?) and folks have scripted to it. Basically, OS distributions can’t just discard such a command.  It just goes that way…no problem.

Way Off Topic
Maybe the next time Dave is in the Bay Area we can repeat the curry! That would be nice.

Mark Hurd Knows CIOs. I Know Trivia. CIOs May Not Care About Either! Hang On, I’m Booting My Cell Phone.

According to this techweb article, one of Oracle’s presidents “knows CIOs.” The article didn’t spend much time substantiating that notion but the title roped me in. I did read the entire article which I feel entitles me to blog a bit.

First, I’ll simply quote a quote that the article attributes to Oracle’ Mark Hurd:

  Hurd reiterated Oracle’s claim that the highly tuned Exadata hardware-software combo yields 70x performance improvements–reports that took 70 minutes now take one minute

Sure, Exadata can easily be 70x faster than some other system.  For instance, the “70-minute system” might have been a 2-socket Harpertown Xeon-based server. That would be about 1/70th Exadata’s database grid–from a CPU perspective. Or, perhaps, the Exadata 70x edge on these “reports” came from improved I/O.  In that case, perhaps the 70-minute system was attached to storage that provided about 1GB/s (e.g.,  a low-end storage array that suffered controller saturation at 1GB/s). That would be about 1/70th the storage bandwidth of a full-rack Exadata configuration. But that all seems unlikely. It is much more likely that someone took the time to tune the query plans used by the “report” in which case the storage and CPU doesn’t really factor as heavily.

Certainly the I/O power of Exadata was not the 70x ingredient. Allow me to explain. If the “report” actually touched the same amount of data in the Exadata case the total data visited would have been about 5 terabytes and nobody runs “reports” that perform nearly 5 TB of disk I/O. We are talking about Oracle database after all and therefore the 70-minute system would have had indexes, partitioning and a other such I/O-elimination features available to it. Visiting nearly 5TB of data after I/O elimination (e.g., partition elimination, indexes, etc)  is unlikely. Unless the query plan was non-optimal (likely). But I’m not blogging about that.

The article continues to quote Mark Hurd:

The customer who says it cost me $7 million to do that job before, you can literally take 70x off that and it costs him $100,000

That’s weird math and I’m simply not going to blog about that.

Finally, the article quotes Mark Hurd’s take on Big Data:

Well, it’s a tough world, man. When I grew up in this industry, there were IBM 360s, DEC VAXs, Data Generals–all that kind of stuff. And this [pointing to his iPhone] is a VAX. The power in this thing is like a VAX.

Alright, so that is the quote I’m blogging about.  The VAX family of products spanned many generations. However, if one mentions IBM 360 and VAX in the same sentence we can safely presume the VAX in mind is of the printed circuit board (PCB) era. While I’m personally not quoted in press articles as “knowing CIOs”, I do know trivia. DEC VAX products of the PCB era were 1MIPS machines.  I cannot impress upon you how terribly disappointed you’d be just waiting for an iPhone application to start up on a 1MIPS system.

No, I can’t go about saying I “know CIOs” but I do know that the processor in my smart phone—a Qualcomm Snapdragon—is a 2100 MIPS processor.

Yes, sadly, 2100x is all I’m blogging about.


DISCLAIMER

I work for Amazon Web Services. The opinions I share in this blog are my own. I'm *not* communicating as a spokesperson for Amazon. In other words, I work at Amazon, but this is my own opinion.

Enter your email address to follow this blog and receive notifications of new posts by email.

Join 741 other subscribers
Oracle ACE Program Status

Click It

website metrics

Fond Memories

Copyright

All content is © Kevin Closson and "Kevin Closson's Blog: Platforms, Databases, and Storage", 2006-2015. Unauthorized use and/or duplication of this material without express and written permission from this blog’s author and/or owner is strictly prohibited. Excerpts and links may be used, provided that full and clear credit is given to Kevin Closson and Kevin Closson's Blog: Platforms, Databases, and Storage with appropriate and specific direction to the original content.