Archive for the 'oracle' Category


Luca Canali’s Wonderful Public Oracle-Related Materials

This is just a quick blog post to direct readers to treasure trove of public information offered by Luca Canali (of CERN).

Let there be no mistake. These are not just ordinary presentations. Many of them have detailed how-to information in the speaker notes to amplify the information in the slides. They fall into the class of must-read.

Enjoy, and thanks, to Luca!

The list:

Compressing very large data sets in Oracle, UKOUG Conference 2009, Birmingham, Dec 2009.

Upcoming: Active Data Guard at CERN, UKOUG 2012 conference, Birmingham, December 4th 2012

Testing Storage for Oracle RAC 11g with NAS, ASM, and SSD Flash Cache, UKOUG 2011 conference, Birmingham, December 6th, 2011

CERN IT-DB Deployment, Status, Outlook – ESA-GAIA DB Workshop, ISDC, March 2011

ACFS under scrutinyUKOUG Conference 2010, Birmingham, Nov 2010

Data Lifecycle Management Challenges and Techniques, a user’s experienceUKOUG Conference 2010, Birmingham, Nov 2010

CERN DB Services for Physics – 2010 Report, Distributed Database Workshop, CERN, Nov 2010

Overview of the CERN DB Services for Physics, Orcan Swedish Oracle Users group Conference, Stockholm, May 2010

Evaluating and testing storage performance for Oracle DBs, UKOUG Conference 2009, Birmingham, Dec 2009.

ASM configuration review, Distributed Database Operations Workshop, CERN, November 2009.

Storage for data management, ‘after C5’ CERN-IT presentation, CERN, May 2009.

Data Lifecycle Review and Outlook, Distributed Database Operations Workshop, Barcelona, April 2009

Database Operations Security Overview, Distributed Database Operations Workshop, Barcelona, April 2009.

Overview of Storage and IT-DM lessons learned, IT-DM technical group meeting, CERN, March 2009.

Implementing ASM Without HW RAID, A User’s Experience, presentation at UKOUG Conference 2008, Birmingham Dec 2008.

Datalifecycle_WLCG_DB_workshop_LC: Data lifecycle management ideas, WLCG Database Workshop, CERN Nov 2008.

Workhops_8_Jul_case_PVSS_LC: Oracle performance tuning case study, PVSS archiver, Database Developers Workshop, CERN 8-7-2008.

Workhops_8_Jul_perf_for_developers_LC: Oracle performance tuning ideas for developers, Database Developers Workshop, CERN 8-7-2008.

Oracle Storage Performance Studies: Scalability tests of VLDBs with RAC and ASM for Physics DB Services, WLCG Workshop, CERN, Apr 2008.

A closer look inside Oracle ASM, talk on Oracle ASM internals and performance measurements at UKOUG 2007, Birmingham, December 2007.

WLCG_Oracle_perf_for_admin: Oracle Performance for Administrators, WLCG Reliability Workshop, CERN November 2007.

Oracle_CERN_Service_Architecture, CERN DB workshop, January 2007.

UKOUG_RACSig_Oct06, UKOUG RAC SIG meeting, UKOUG RACSIG meeting, London, October 2006.

DB services at CERN HEPIX 2006: “Database Services for Physics at CERN with Oracle 10g RAC”, HEPIX conference, Rome, April 2006.

DB_Serv_Meeting_ASM_Perf: “ASM-based storage to scale out Database Services for Physics”, April 2006

3D_RAL_Mar_06: “Oracle 10gR2 configuration”, 3D DB Workshop at RAL (UK), March 2006.

T2_tutorials_Jun06_OracleRAC: Oracle and RAC for Physics DB June 2006

For more information visit Luca Canali’s page here: http://canali.web.cern.ch/canali/main.htm

My First Words About Oracle Exadata X3 In-Memory Database Machine

I’ve had countless emails from readers asking for a technical analysis of what Oracle announced at Openworld 2012 pertaining to the X3 refresh of Exadata Database Machine. I attended the show, fell ill and subsequently had a a lot of work backlog to clear. I will get to this next week and, not surprising to readers of this blog, I’ll take aim on  the following words: “Database In-Memory Machine” as they appear in the new marketing nickname for Exadata Database Machine.

Yes, I will blog the matter but would first like to recommend the following excellent blog posts by @flashdba as they relate to “Database In-Memory Machine”:

In Memory Databases Part I

In Memory Databases Part II

Note: Part II has one tiny bit of errata as discussed in the comment section of the post. The post speaks of the cache hierarchy of X3 and includes Exadata Storage Server DRAM in the aggregate. I need to point out that we know from reading the myriads of public information on the matter (Oracle’s whitepapers, employee blogs and Expert Oracle Exadata (Apress)) that the DRAM in Exadata Storage Server cells is not used for cache. DRAM in the storage servers is used for management (metadata) of Exadata Smart Flash Cache contents, Storage Indexes metadata and buffering (IB dend/receive buffers, HCC decompression output, etc). The cache hierarchy of X3 is quite succinctly host DRAM (SGA buffers and Results Cache) and Exadata Smart Flash Cache (the PCI flash devices accessed via SCSI disk driver through the Linux block I/O layer in the cells).


Announcing The Oracle Real World Conference. Attending Oracle OpenWorld 2012? Great, It Happens To Coincide With This Great Event!

BLOG UPDATE 2012-09-21: The conference organizers had to dodge legal bullets from Oracle Corporation for using the word Oracle. So, the name of the conference changed to Oaktable World:

This is just a quick announcement about a great conference hosted by the good folks at Delphix, Miracle and Pythian.

Please visit the Oracle Real World website for session and venue information.

I’ll be offering a session called “SLOB Why, How and What’s It Got To Do With Exadata.” Attendees will learn how to put SLOB to use for their benefit. They might even learn something important about Exadata as an added bonus.

Please follow this link to the website to learn more.

Oracle Announces the World’s Second OLTP Machine. Public Disclosure Of Exadata Futures With Write-Back Flash Cache. That’s a Sneak Peek At OOW 2012 Big News.

The Enkitec Extreme Exadata Expo is well underway having just brought day 1 to a close with a keynote from Oracle’s Senior Vice President of Database Server Technology, Andy Mendelsohn.

Mr. Mendelson ended his presentation with a slide of futures for Exadata. Frits Hoogland tweeted the slide here.

I too was listening in on the presentation as a virtual attendee. I heard Mr. Mendelsohn state that the features fall into the “within 12 months” category. I suppose that means coinciding with Oracle Database 12.2 (note, dot-2). I could certainly be wrong on that matter though. Perhaps 12.1. We’ll see.

Of the items on the list I’d say the most interesting was the “Flash for all writes” item. The bullet point is enhanced with a pledge of 10x more writes for write-heavy OLTP. I knew of this feature and its eventual release, but now the information is public.

As my many posts on the matter attest, I have been critical of Oracle referring to Exadata as the “World’s First OLTP Machine” simply because it has read-cache. OLTP requires the scaling of writes along with reads. However, according to Oracle’s Exadata datasheets, the “World’s First OLTP Machine” is currently capable of 1.5 million read IOPS in a full-rack X2 configuration but only 50,000 gross random writes. With normal ASM redundancy the gross is reduced to a net WIOPS capacity of approximately 25,000 or a read:write ratio of 60:1. Many users feel compelled to use ASM high redundancy for reasons outside the scope of this post.

An increase in 10x would be 500,000 WIOPS (gross) which, being a write-back cache, will have to be de-staged back to spinning media at some point.

It will be interesting to see how this feature plays out. On first glance it would appear as though the goal is to support a read:write ratio of 6:1 which is drastically better than the World’s First OLTP Machine. If the World’s Second OLTP Machine can handle the de-staging from cache back to spinning media I’ll say kudos. Until we know, we can only guess.

Personally, I’m putting my bets on completely non-mechanical approaches for solving write-intensive OLTP problems. That’s another way of saying total flash storage.  However, I’d also stack up auto-tiering (e.g., EMC FAST) against this approach because the de-staging requirement is reduced as blocks are promoted to Enterprise Flash Drives. I have not performed any benchmark to back that viewpoint…but then I suspect a feature intended to see light of day “within 12 months” is getting much benchmark action within Oracle development either. There again, I could be wrong because I no longer work there.

What Are People Buying This Stuff For?
Since the vast majority of Exadata sales are quarter-rack configurations deployed for applications other than Data Warehousing I think Oracle is focusing on the correct weaknesses.

If you’re interested, I spoke of closely related topics in my recent interview in the August edition of the Northern California Oracle User Groups journal.

Finally, if you haven’t seen my video presentations on the fundamental architectural reasons Exadata is inferior to other solutions in the marketplace for the DW/BI/Analytics use case, I recommend you give them a viewing. Doing so might help you understand why Oracle sells more Exadata for use cases other than DW/BI and, in turn, why they focus on features that have nothing to do with that use case–like write-back flash cache.

SLOB Is Not An Unrealistic Platform Performance Measurement Tool – Part III. Calibrate, What?

Parts I an II of this series can be found here and here.

My previous installments in this series delved into how Orion does not interact with the operating system in any way similar to a database instance. This is a quick blog entry about CALIBRATE in that same vein.
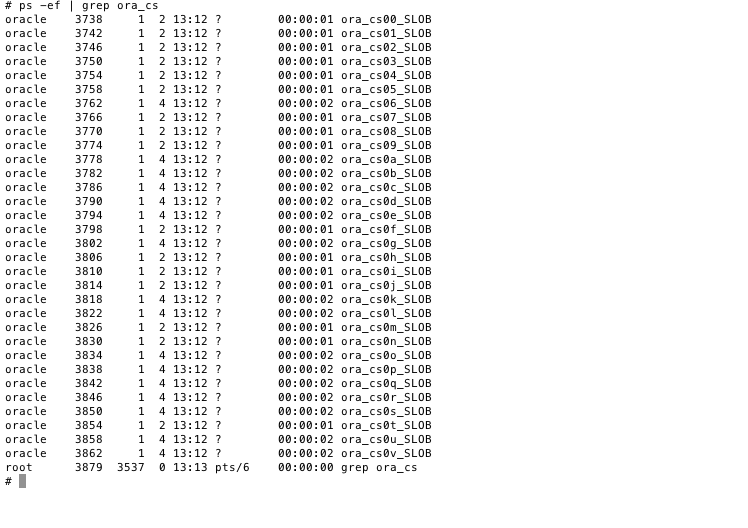
On a system with 32 logical CPUs (e.g., 2s8c16t) we see CALIBRATE spawn off 32 background processes called ora_cs* such as the following ps(1) output screenshot:

I picked one of the processes and straced it to reveal the fact that CALIBRATE uses several processes each performing large-batch asynchronous I/O to do its job:

This should be a revelation to the purists out there. In my assessment I think CALIBRATE may even deviate worse from the goal of mimicking instance I/O than does Orion!
Nobody really cares about platforms though. So this is one of those “for what it’s worth” posts

Expert Oracle Exadata (Apress) Translated Into Chinese


Kerry Osborne has a short post to point out that the last book I worked on has been translated into Chinese.  The photo of the book cover looks pretty cool…if only I could read anything except for our names and a few stray English words 🙂

This book is a must-read for anyone that wants to cut beyond the hype and actually learn Exadata.


Fault Injection Testing. Spurious Space Depletion? Sure, Why Not?

When file systems run out of space bad things happen. We like to investigate what those “bad things” are but to do so we have to create artificially small installation directories and run CPU-intensive programs to deplete the remaining space. There is a better way on modern Linux systems.

If you should find yourself performing Linux platform fault-injection testing you might care to add spurious space free failures. The fallocate() routine immediately allocates the specified amount of file system space to an open file.  It might be interesting to inject random space depletion in such areas as Oracle Clusterware (Grid Infrastructure) installation directories or application logging directories. Could a node ejection occur if all file system space immediately disappeared? What would that look like on the survivors? What happens if large swaths of space disappear and reappear? Be creative with your destructive tendencies and find out!


#include <asm/unistd.h>
#include <errno.h>
#include <fcntl.h>
#include <stdio.h>
#include <stdlib.h>
#include <string.h>
#include <sys/stat.h>
#include <sys/syscall.h>
#include <sys/types.h>
#include <unistd.h>


int main(int argc, char *argv[])
{
long int sz;
char *fname;
int ret,fd;

if (argc != 3)
{
fprintf(stderr, "usage: %s file new-size-in-gigabytes\n", argv[0]);
return(-1);
}

fname = argv[1];
sz   = atol(argv[2]);

if ((ret = (fd = open(fname, O_RDWR | O_CREAT | O_EXCL, 0666)))  == -1 ) {
perror("open");
return(ret);

}
if ( (ret = fallocate( fd, 0, (loff_t)0, (loff_t)sz * 1024 * 1024 * 1024 )) != 0 ){
perror ("fallocate");
unlink( fname );
}

close(fd);
return ret;
}


#
# cc fast_alloc.c
#
# ./a.out
usage: ./a.out file new-size-in-gigabytes
#
# df -h .
Filesystem Size Used Avail Use% Mounted on
/dev/sdc 2.7T 1.6T 1.2T 57% /data1
#
# time ./a.out bigfile 512
real 0m1.875s
user 0m0.000s
sys 0m0.730s
# du -h bigfile
513G bigfile
# rm -f bigfile
#
# ./a.out bigfile 512
# ls -l bigfile
-rw-r--r-- 1 root root 549755813888 Jul 1 09:48 bigfile

Putting SLOB (The Silly Little Oracle Benchmark) To Use For Knowledge Sake!

This is just a short blog entry here to refer folks interested in SLOB to the following links:

About SLOB:  Introducing SLOB – The Silly Little Oracle Benchmark

Introducing A LinkedIn Group For SLOB Users

This is just a very short blog entry to inform folks that there is an open discussion group over at LinkedIn for SLOB topics of interest.

The group can be accessed through the following link:  SLOB LinkedIn Group.

Simple SLOB Init.ora Parameter File For Read IOPS Testing

This is just a quick blog entry to show the very simple init.ora parameter file I use to stress simple read IOPS testing with SLOB.  On 2s16c32t E5-2600 servers attached to very fast storage this init.ora parameter delivers on the order of 275,000 physical IOPS with 64 SLOB sessions.

I’ll post an init.ora that I use for the REDO model and DBWR testing as soon as possible.

Thanks to Yury for the recommended hidden init.ora parameters to boost the ratio of db file sequential reads.

Additional information can be found here: README file.

Here is the init.ora:

UNDO_MANAGEMENT=AUTO
db_block_size = 8192
db_files = 20000
processes = 500
shared_pool_size = 5000M
db_cache_size=128M
filesystemio_options=setall
parallel_max_servers=0
_db_block_prefetch_limit=0
_db_block_prefetch_quota=0
_db_file_noncontig_mblock_read_count=0
log_buffer=134217728
pga_aggregate_target=1G

SLOB Is Not An Unrealistic Platform Performance Measurement Tool – Part II. If It’s Different It’s Not The Same.

In Part I of this series I discussed the concept of “Mindless I/O” and contrasted Orion I/O testing to SLOB.

Some time has passed since that post and a lot of folks have been studying their systems using SLOB. Others have been motivated to prove that the differences between SLOB and Orion are moot. I’m OK with that because I use both of them and a large array of other I/O tools (fio, bonnie, etc,etc).

Test Single Block Random Reads With SLOB And Call It A Day
There is something I’d like to quickly point out about SLOB.

SLOB has 4 models for testing. Since it is a real SGA it can be used for testing the platform’s ability to handle SGA-cached workloads. Think about it. If your platform can’t scale up cached reads you’ve got a problem. This is what a lot of us SLOB users refer to as Logical I/O testing where the metric is LIOPS (logical I/O per second). Another model is, of course, the simple random read model. There are also two models that stress genuine DBWR and LGWR functionality and those models cannot be mimicked accurately, or otherwise, with Orion. Orion is mindless I/O. That fact matters to me and perhaps will matter to some of you as well.

Click here for more on the different SLOB models.

Cool Idea: Let’s use Asynchronous I/O Libraries To Determine Platform Fitness For High-Rate Synchronous I/O
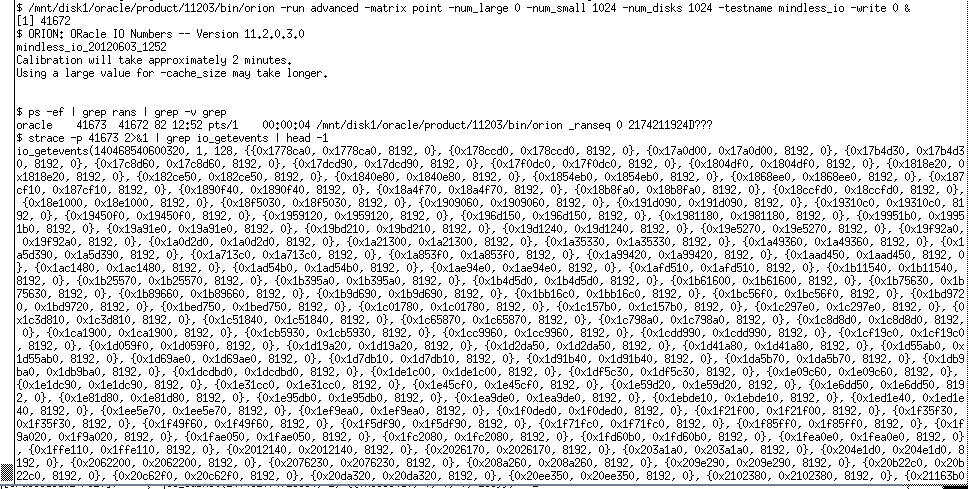
Another thing to be aware of with Orion (as I pointed out 6 years ago) is the fact that Orion actually uses the wrong library for performing random single block reads (db file sequential read).  Yes, it uses VOS routines (skgf*), but the wrong ones–at least for the random single block read tests. The following screen shot shows Orion attempting to measure platform suitability for Oracle single block random reads (the db file sequential read model). Oracle instances do not use io_submit()/io_getevents() for db file sequential read:

A real Oracle process (such as a SLOB session) uses synchronous I/O (specifically libC pread()) to service db file sequential read. Yes, I know this varies by file storage type, dNFS, Exadata and other variations but I’m on blisteringly fast storage accessed via direct I/O through an XFS file system–a perfectly supported storage provisioning approach. Nonetheless, in all cases Oracle instances perform single-block I/O when performing single-block blocking I/O–not some FrankenSynchronousIO(tm) such as a single-block request through the asynchronous API followed by a group-reaping of outstanding requests as Orion is doing in the above screenshot. The screen shot shows a single Linux process (Orion) reaping 128 previously-submitted asynchronous I/Os whilst aiming to simulate db file sequential read.

So, if you happen to be testing modern, non-mechanical storage at a rate of, say, 20,000 IOPS/core you are missing out on the joy of analyzing the associated cost of 20,000 context switches/sec. Most people think a system call is a context switch–it isn’t. A context switch is the stopping of a process, saving its state, executing the scheduler code and switching to the context of another process. When a scheduler gets to make 20,000 affinity (NUMA, L2 cache, etc) decisions per second you get the opportunity of learning whether you like the choices it is making. I prefer to know as opposed to blind faith in the OS. A platform is more than the sum of all it’s components. It needs to all come together.

Another problem with using libaio in place of synchronous pread() is the fact that I/Os submitted in the asynchronous path are flat-out handled differently–and different is not the same as same. This is the case on all operating systems I know of. When requests are submitted through the asynchronous interfaces there are opportunities for the OS to potentially optimize the strategy for servicing the I/O. After all, the I/Os have been submitted from a single process context whereas the same number of I/O requests funneling through the synchronous interface means associating the request with a potentially vast numbers of discrete processes. It’s just different, not “slightly less-same”, but different. And different matters–at least to me.

It’s Just Different–And That’s All That Matters
There are some folks in the blogosphere putting in good SLOB testing. Some good folks at Pythian are doing the heavy lifting of proving to you that SLOB and Orion are on par or even, perhaps, Orion is somehow better for testing random reads. I should point out that random reads testing is just a miniscule portion of platform performance analysis. The fact that SLOB and Orion are different is all that matters to me. I need more tools than just a hammer. And when I need a hammer I don’t what a screwdriver that feels serendipitously hammer-like.

Once again I want to thank Yury for testing SLOB. Even if I don’t agree with his conclusions I very much appreciate his work with the kit. Healthy disagreements are healthy. We cultivate these threads and we all learn (I presume).

Different In So Many Ways
So if you are reading this, and are about to begin SLOB testing please be mindful of the following “feature overview” vis a vis SLOB:

  • SLOB is an Oracle instance. It doesn’t toil along trying to behave like an instance nor challenge your faith in accepting the differences as unimportant.
  • SLOB is not mindless I/O. You get the chance to learn more about your platform when the CPUs are actually doing something. I/O is not no longer a probelm with modern platforms. It’s all about CPU–always has been but obscured by artificial storage plumbing problems.
  • SLOB uses the right routines. If you want to study the fitness for a given platform to handle high-rate db file sequential read you might as well do db file sequential read–or at least use a tool that calls the proper system calls. Libaio and LibC share letters of the alphabet but they are really different–and different in this specific regard matters. Actaully, different always matter to me.
  • SLOB will allow you to test / study DBWR and LGWR. If you can get Orion to aid you in the study of log file sync or DBWR flushing capacity please drop me a note  because I missed the memo 🙂 .

About Part III
I discussed “Mindless I/O” in Part I. I needed to inject this installment to point out the little bits about Orion using libaio when you want to test synchronous reads. When I get to Part III I’ll get back to the Mindless I/O topic.

SLOB Is Not An Unrealistic Platform Performance Measurement Tool – Part I. Let’s See If That Matters…To Anyone.

I just checked to find out that there has been 3,000 downloads of SLOB – The Silly Little Benchmark. People seem to be putting it to good use. That’s good.

Before I get very far in this post I’d like to take us back in time–back before the smashing popularity of the Orion I/O testing tool.

When Orion first appeared on the scene there was a general reluctance to adopt it. I suspect some of the reluctance stemmed from the fact that folks had built up their reliance on other tools like bonnie, LMbench, vxbench and other such generic I/O generators. Back in the 2006 (or so) time frame I routinely pointed out that no tool other than Orion used the VOS layer Oracle I/O routines and libraries. It’s important to test as much of the real thing as possible.

Who wants to rely on an unrealistic platform performance measurement tool after all?

My “List”
Over time I built a list of reasons I could no longer accept Orion as sufficient for platform I/O testing. Please note, I just wrote “platform I/O testing” not “I/O subsystem testing.”  I think the rest of this post will make the distinction between these two quoted phrases quite clear. The following is a short version of the list:

  • Orion does not simulate Oracle processing in any way, shape or form. More on that as this blog series matures.
  • Orion is what I refer to as mindless I/O. More on that as this blog series matures.
  • Orion is useless in assessing a platform’s capability to handle modify-intensive DML (thus REDO processing, LGWR and DBWR, etc). More on that as this blog series matures.

My present-tense views on Orion sometimes surface on twitter where I am occasionally met with vigorous disagreement–most notably from my friend Alex Gorbachev. Alex is a friend, co-member of the Oaktable Network, CTO of Pythian (I love those Pythian folks), and someone who generally disagrees with most everything I say.

I respect Alex, because he has vast knowledge and valuable skills. His arguments make me think. That’s a good thing. I’m not sure, however, our respective spheres of expertise overlap.

So how do these disagreements regarding SLOB get started? Recently I tweeted:

The difference between SLOB and Orion is akin to Elliptical trainer versus skiing on the side of a mountain.

Alex replied with:

I could just as well argue that SLOB is useless because that’s not real workload anyway and you should test with your app

This quick exchange of ideas set into motion some Pythian testing by Yury. As it turns out I think the goal of that test was to prove parity between SLOB and Orion for random reads–and perhaps not much more.  If only I had published “My List” above before then.

Yury’s tests were good, albeit, exceedingly small in scope. His blog post suggests more testing on the way. That is good. If you read the comment thread on his blog entry you’ll see where I thank Yury for a good tweak to the SLOB kit that eliminates the db file parallel reads associated with the index range scans incurred by SLOB reader processes. Come to think of it though, Matt from Violin Memory pointed that one out to me some time back. Hmm, oh well, I digress. The modifications Yury detailed (init.ora parameters) will be included in the next drop of the SLOB kit. Again, thanks Yury for the testing and the init.ora parameter change recommendations!

Feel free to see Yury’s findings. They are simple: SLOB and Orion do the same thing. Really, SLOB and Orion do the same thing? Well, that may be the case so long as a) you compare SLOB to Orion only for simple random read testing and/or b) your testing is limited to a little, itsy-bitsy, teeny, tiny, teensy, minute, miniscule, meager, puny, Lilliputian-grade undersized I/O subsystem incapable of producing reasonable, modern-scale IOPS.  Yury’s experiment topped out at roughly 4,500 random read IOPS.  I’ll try to convince you that there is more to it than that (hint, modern servers are fit for IOPS in the 20,000/core range). But first, I have two quotable quotes to offer at this point:

When assessing the validity of an I/O testing tool, do so on a system that isn’t badly bottlenecked on storage.

If your application (e.g., Oracle Database)  is “mindless” use a “mindless” I/O generator–if not, don’t.

Mindless I/O
So what do I mean when I say “mindless I/O?”  The answer to that is simple. If the code performs an I/O into a memory buffer, without any application concurrency overhead, and no processes even so much as peeks at a single byte of that buffer populated through DMA from the I/O adapter device driver–it’s mindless. That is exactly how Orion does what it does. That’s what every other synthetic I/O generator I know of does as well.

So what does mindless I/O look like and why does it show up on my personal radar as a problem? Let’s take a look–but first let me just say one thing–I analyze I/O characteristics on extremely I/O capable platforms. Extremely capable.

The following screen shot shows a dd(1) command performing mindless I/O by copying an Oracle OMF datafile from an XFS file system to /dev/null using direct I/O. After that another dd(1) was used to show the difference between “mindless” and meaningful I/O. The second dd(1) was meaningful because after each 1 MB read the buffer is scanned looking for lower case ASCII chars to convert to their upper-case counterpart. That is, the second dd(1) did data processing–not just a mindless tickling of the I/O subsystem.

The mindless I/O was 2.5 GB/s but the meaningful case fell to about 1/6th that at 399 MB/s. See, CPU matters. It matters in I/O testing. CPU throttles I/O–unless you are interested in mindless I/O. What does this have to do with Orion and SLOB? A moment ago I mentioned that I test very formidable I/O subsystems commensurate with modern platforms–so hold on to your hat while I tie these trains of thought together.

Building on my dd(1) example of mindless I/O, I’ll offer the following screen shot which shows Orion accessing the same OMF SLOB datafile (also via direct I/O validated with strace). Notice how I force all the threads of Orion (it’s threaded with libpthreads) to OS CPU 0 using numactl(8) on this 2s12c24t Xeon 5600 server?  What you are about to see is the single-core capacity of Orion to perform “mindless I/O”:

Unrealistic Platform Performance Measurement Tools
This is only Part I in this series.  I’ll be going through a lot of proof points to solidify backing for my Orion-related assertions in the list above, but please humor me for a moment. I’d like to know just how realistic are platform performance measurements from an I/O tool that demonstrates capacity for 144,339 physical 8K random IOPS while pinned to a single core of a Xeon 5600 processor?

We are interested in database platform IOPS capacity, right?

Through this blog series I aim to help you conclude that any tool demonstrating such an unrealistic platform performance measurement is, well, an unrealistic platform performance measurement tool.

Do you feel comfortable relying on an unrealistic platform performance measurement tool? Before I crafted SLOB I too accepted test results from unrealistic platform performance measurement tools but I learned that I needed to include the rest of the platform (e.g., CPU, bus, etc) when I’m studying platform performance so I left behind unrealistic platform performance measurement tools.

Until recently I didn’t spend any time discussing measurements taken from unrealistic platform performance measurement tools. However, since friends and others in social media are pitting unrealistic platform performance measurement tools against SLOB (not an unrealistic platform performance measurement tool) such comparisons are blog-worthy. Hence, I’ll trudge forward blogging about how unrealistic certain unrealistic platform performance measurement tools are. And, if you stay with me on the series, you might discover some things you don’t know because, perhaps, you’ve been relying on unrealistic platform performance measurement tools.

As this series evolves, I’ll be sharing several similar unrealistic platform performance measurement tool results as I go though the list above. That is, of course, what motivated me to leave behind unrealistic platform performance measurement tools.

Final Words For This Installment
In Yury’s post he quoted me as having said:

It’s VERY easy to get huge Orion nums

His assessment of that quote was, “kind of FALSE on this occasion.”  Having now shown what I mean by “VERY easy” (e.g., even a single core can drive massive Orion IOPS) and “huge Orion” numbers  (e.g., 144K IOPS), I wonder whether Yury will be convinced about my assertions regarding unrealistic platform performance measurement tools? If not yet, perhaps he, and other readers will eventually. After all, this is only Part I. If not, Yury, I still want to say, “thanks for testing with SLOB and please keep the feedback coming.”

Oh, by the way folks, if all you have is Orion, use it. It is better than wild guesses–at least a little better.

Link to Part II of this series.
Quick Reference README File For SLOB – The Silly Little Oracle Benchmark

BLOG UPDATE 2012.06.29: For additional how-to help with SLOB please visit Karl Arao’s setup cheat-sheet

This is just a quick blog entry with the main README file from SLOB – The Silly Little Oracle Benchmark. I frequently findings myself referring folks to the README so I thought I’d make it convenient. I’ve also uploaded this in PDF form here.

            SLOB - Silly Little Oracle Benchmark

INDEX
    INTRO
    NOTE ABOUT SMALL SGA
    SETUP STEPS
    RELOADING THE TABLES
    RESULTS
    TERMINOLOGY
    HOW MANY PROCESSES DO I RUN
    NON-LINUX PLATFORMS    

INTRO
-----
This kit does physical I/O. Lot's of it. 

The general idea is that schema users connect to the instance and 
execute SQL on their own tables and indexes so as to eliminate as much SGA *application* sharing as possible. SLOB aims to stress Oracle internal concurrency as opposed to application-contention. It's all about database physical IO ( both physical and logical) not application scaling.

The default kit presumes the existence of a tablespace called IOPS. If 
you wish to  supply another named tablespace it will be given as a 
argument to the setup.sh script. More on this later in this README.

To create the schemas and load data simply execute setup.sh as the Oracle 
sysdba user. The setup.sh script takes two arguments the first being the 
name of the tablespace and the second being how many schema users to load. 
A high-end test setup will generally load 128 users. To that end, 128 is 
the default.

To run the test workload use the runit.sh script. It takes two arguments 
the first being the number of sessions that will attach and perform modify 
DML (UPDATE) on their data (writer.sql) and the second directs how many sessions 
will connect and SELECT against their data (reader.sql). 

NOTE ABOUT SMALL SGA
--------------------
The key to this kit is to run with a small SGA buffer pool to force physical 
I/O. For instance, a 40MB SGA will be certain to result in significant physical 
IOPS when running with about 4 or more reader sessions. Monitor free buffer waits 
and increase db_cache_size to ensure the run proceeds without free buffer wait 
events.

Oracle SGA sizing heuristics may prevent you from creating a very small SGA
if your system has a lot of processor cores. There are remedies for this. 
You can set cpu_count in the parameter file to a small number (e.g., 2) and this
generally allows one to minimize db_block_buffers. Another approach is
to create a recycle buffer pool. The setup.sh script uses the storage 
clause of the CREATE TABLE command to associate all SLOB users' tables
with a recycle pool. If there happens to be a recycle pool when the 
instance is started then all table traffic will flow through that
pool. 

SETUP STEPS
-----------
1. First, create the trigger tools. Change directory to  ./wait_kit 
   and execute "make all"
2. Next, execute the setup.sh script, e.g., sh ./setup.sh IOPS 128
3. Next, run the kit such as sh ./runit.sh 0 8

RELOADING THE TABLES
--------------------
When setup.sh executes it produces a drop_users.sql file. If you need to 
re-run setup.sh it is optimal to execute drop_users.sql first and then 
proceed to re-execute setup.sh.

RESULTS
-------
The kit will produce a text awr report named awr.txt. The "awr" directory 
scripts can be modified to produce a HTML awr report if so desired. 

TERMINOLOGY
-----------
SLOB is useful for the following I/O and system bandwidth testing:

1. Physical I/O (PIO) - Datafile focus
    1.1 This style of SLOB testing requires a small db_block_cache
    setting. Small means very small such as 40MB. Some
    users find that it is necessary to over-ride Oracle's built
    in self-tuning even when supplying a specific value to 
    db_cache_size. If you set db_cache_size small (e.g., 40M)
    but SHOW SGA reveals an over-ride situation, consider 
    setting cpu_count to a very low value such as 2. This will
    not spoil SLOB's ability to stress I/O.
    1.2 Some examples of PIO include the following:
        $ sh ./runit.sh 0 32   # zero writers 32 readers
        $ sh ./runit.sh 32 0   # 32 writers zero readers
        $ sh ./runit.sh 16 16  # 16 of each reader/writer
2. Logical I/O (LIO)
    2.1 LIO is a system bandwidth and memory latency test. This 
    requires a larger db_block_cache setting. The idea is to 
    eliminate Physical I/O. The measurement in this testing mode 
    is Logical I/O as reported in AWR as Logical reads.
3. Redo Focused (REDO)
    3.1 REDO mode also requires a large SGA. The idea is to 
    have enough buffers so that Oracle does not need to
    activate DBWR to flush. Instead, LGWR will be the
    only process on the system issuing physical I/O. This 
    manner of SLOB testing will prove out the maximum theoretical
    redo subsystem bandwidth on the system. In this mode
    it is best to run with zero readers and all writers.

HOW MANY PROCESSES DO I RUN?
----------------------------
I recommend starting out small and scaling up. So, for instance,
a loop of PIO such as the following:
    $ for cnt in 1 2 4 8
    do
        sh ./runit.sh 0 $cnt
    done

Take care to preserve the AWR report in each iteration of the loop.
The best recipe for the number of SLOB sessions is system specific. 
If your system renders, say, 50,000 PIOPS with 24 readers but starts
to tail beyond 24 then stay with 24.

In general I recommend thinking in terms of SLOB sessions per core.

In the LIO case it is quite rare to run with more readers.sql than the
number of cores (or threads in the case of threaded cores). On the other 
hand, in the case of REDO it might take more than the number of cores 
to find the maximum redo subsystem throughput--remember, Oracle does 
piggy-back commits so over-subscribing sessions to cores might be 
beneficial during REDO testing.

NON-LINUX PLATFORMS
-------------------
The SLOB install directory has of README.{PLATFORM} files and 
user-contributed, tested scripts under the ./misc/user-contrib directory.

Xeon E5-2600 OS CPU To Core / SMT Thread Mapping On Linux. It Matters.

Ages ago I blogged about the Intel topology tool and mapping Xeon 5500 (Nehalem EP) processor threads to OS CPUs on Linux. I don’t recall if I ever blogged the same about Xeon 5600 (Westmere EP) but I’ll cover that processor and Xeon E5-2600 in this short post.  First, Xeon 5600.

The following two screen shots are socket 0 and socket 1 from a Xeon 5600 server. Socket 0 first:

Now, socket 1:

So, based on the information above, one would have to specify OS CPUs 0,1,2,3,4,5 if they wanted thread 0 from the first 3 cores on each CPU (c0_t0). I never liked that much. That’s why I’m glad Sandy Bridge presents itself in a more logical manner. As you can see from the following two screen shots, specifying affinity for thread 0 of cores on socket 0 is as simple as 0,1,2,3,4,5,6,7. First, socket 0:

And now, socket 1:

Lest this come off as simple tomfoolery, allow me to show the 2x difference in siphoning off a fifo when the data flows socket-local versus socket-remote:

Be aware that this level of disparity will not necessarily be realized when a server is booted SUMA (nor even when BIOS NUMA is enabled but the grub boot string includes numa=off). I’d test the difference and blog that here but that would just be tomfoolery 🙂

Oracle Database 11g Certification For RHEL6 / OEL6 Has Finally Materialized!

Big news, short post.  I fully expected Oracle to skip certifying 11g on RHEL6 / OEL6 opting instead to encourage (force?) adoption of the next major release 12c.

http://finance.yahoo.com/news/oracle-announces-certification-oracle-database-192400398.html


DISCLAIMER

I work for Amazon Web Services. The opinions I share in this blog are my own. I'm *not* communicating as a spokesperson for Amazon. In other words, I work at Amazon, but this is my own opinion.

Enter your email address to follow this blog and receive notifications of new posts by email.

Join 741 other subscribers
Oracle ACE Program Status

Click It

website metrics

Fond Memories

Copyright

All content is © Kevin Closson and "Kevin Closson's Blog: Platforms, Databases, and Storage", 2006-2015. Unauthorized use and/or duplication of this material without express and written permission from this blog’s author and/or owner is strictly prohibited. Excerpts and links may be used, provided that full and clear credit is given to Kevin Closson and Kevin Closson's Blog: Platforms, Databases, and Storage with appropriate and specific direction to the original content.